The Production of Spectra (HSC SSCE Physics): Revision Notes
The Production of Spectra
Introduction
Information about stars, galaxies, and other celestial objects comes primarily from the electromagnetic radiation they emit. By analyzing this light using spectral analysis, astronomers can determine the composition, temperature, motion, and many other properties of distant objects. Understanding how different types of spectra are produced is fundamental to interpreting astronomical observations.
A spectrum is produced when light from a source passes through a device that separates the different wavelengths. This separation allows us to observe the individual colors and wavelengths that make up the light. The human eye cannot observe spectra directly because our brain interprets combinations of colors and wavelengths as a single resultant color. When the right combination of colors is present, we perceive white light.
This is why we need special instruments called spectroscopes to observe and analyze spectra properly. Without these devices, we would only see the combined effect of all wavelengths, not the individual components that provide such valuable information about celestial objects.
Dispersion of light
When white light passes through a triangular glass prism, it undergoes dispersion - the separation of light into its component colors. This happens because different wavelengths of light refract (bend) by different amounts as they pass through the glass. Shorter wavelengths (blue and violet) bend more than longer wavelengths (red and orange). The result is the familiar rainbow pattern we observe.
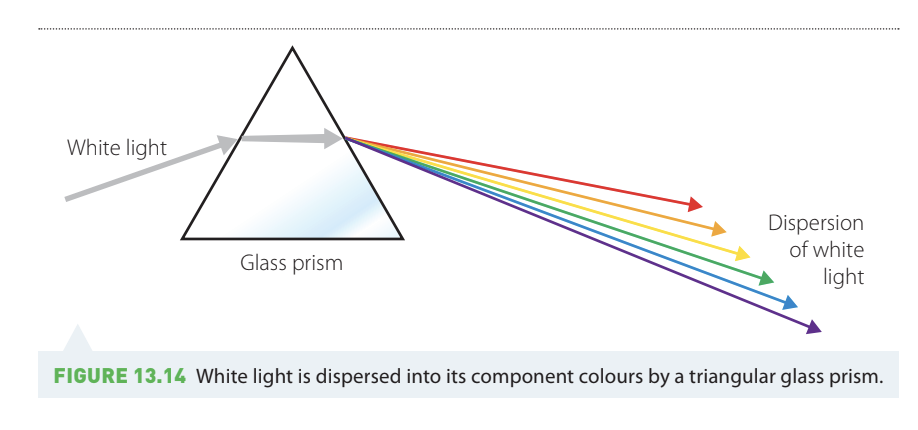
Raindrops in the atmosphere produce the same effect, which is why we see rainbows in nature. The prism or raindrop acts as the device that spreads the wavelengths apart, making the individual colors visible. The order of colors from longest to shortest wavelength is remembered by the mnemonic ROY G BIV (Red, Orange, Yellow, Green, Blue, Indigo, Violet).
Types of spectra
There are three main types of spectra that astronomers observe: emission spectra, absorption spectra, and continuous spectra. Each type is produced by different physical processes and provides different information about the source.
Emission spectra
An emission spectrum is produced when atoms in a low-pressure gas are heated or excited by other means, such as a strong electric field. This type of spectrum appears as bright colored lines against a dark background.
The production of an emission spectrum involves energy transitions within atoms. According to Niels Bohr's model of the atom, electrons orbit the nucleus in specific allowed energy levels. When an atom absorbs energy, an electron can "jump" from a lower energy level to a higher one. The atom is then in an excited state. This process is shown in the diagram below:
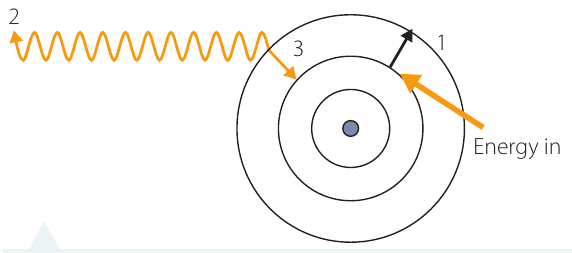
The excited atom does not remain in this state for long. The electron quickly returns to its original or ground state by releasing the absorbed energy as a photon of light. The frequency of the emitted photon is determined by the equation:
where:
- is the energy difference between the two energy levels
- is Planck's constant ( J s)
- is the frequency of the emitted light
Because the allowed energy levels are fixed and unique for each element, only certain specific frequencies can be emitted. This means each element produces its own characteristic pattern of bright lines - like a fingerprint that identifies the element. This is the fundamental principle that allows astronomers to determine the composition of distant stars and galaxies.
Common sources of emission spectra include gas discharge tubes, fluorescent light tubes, and sodium or mercury vapor street lights. The photograph below shows a sodium vapor street lamp, which emits a characteristic yellow-orange light:
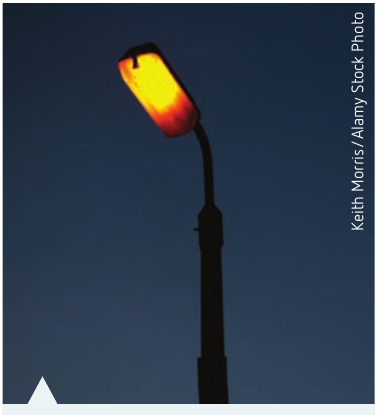
When these sources are viewed through a spectroscope, they show distinct bright lines at specific wavelengths, with darkness between the lines. Each element has its own unique emission spectrum, which makes spectroscopy a powerful tool for identifying the composition of light sources, including distant stars and galaxies.
Memory aid: Remember "UP absorb, DOWN emit" - electrons absorb energy when jumping UP to higher levels, and emit energy when moving DOWN to lower levels.
Absorption spectra
An absorption spectrum is produced when electrons in atoms, ions, or molecules absorb radiation at specific wavelengths. This type of spectrum appears as dark lines against a bright continuous background - the opposite of an emission spectrum.
Absorption spectra are particularly important in astronomy because this is the type of spectrum we observe from stars. The core of a star produces a continuous spectrum due to its extremely high temperature. However, as this light passes through the cooler atmosphere of the star, atoms in the atmosphere absorb specific wavelengths corresponding to their energy level differences.
Here's how the absorption process works in stellar atmospheres:
- A photon with exactly the right energy encounters an atom in the star's atmosphere
- An electron in that atom absorbs the photon and jumps to a higher energy level
- The absorbed energy is re-emitted very quickly - but critically, it is re-emitted in all directions, not just in the original direction from the star's core
- Only a small fraction of the re-emitted light continues in the direction toward Earth
This means that certain wavelengths appear diminished or absent in the light we receive from the star, creating dark absorption lines in the spectrum.
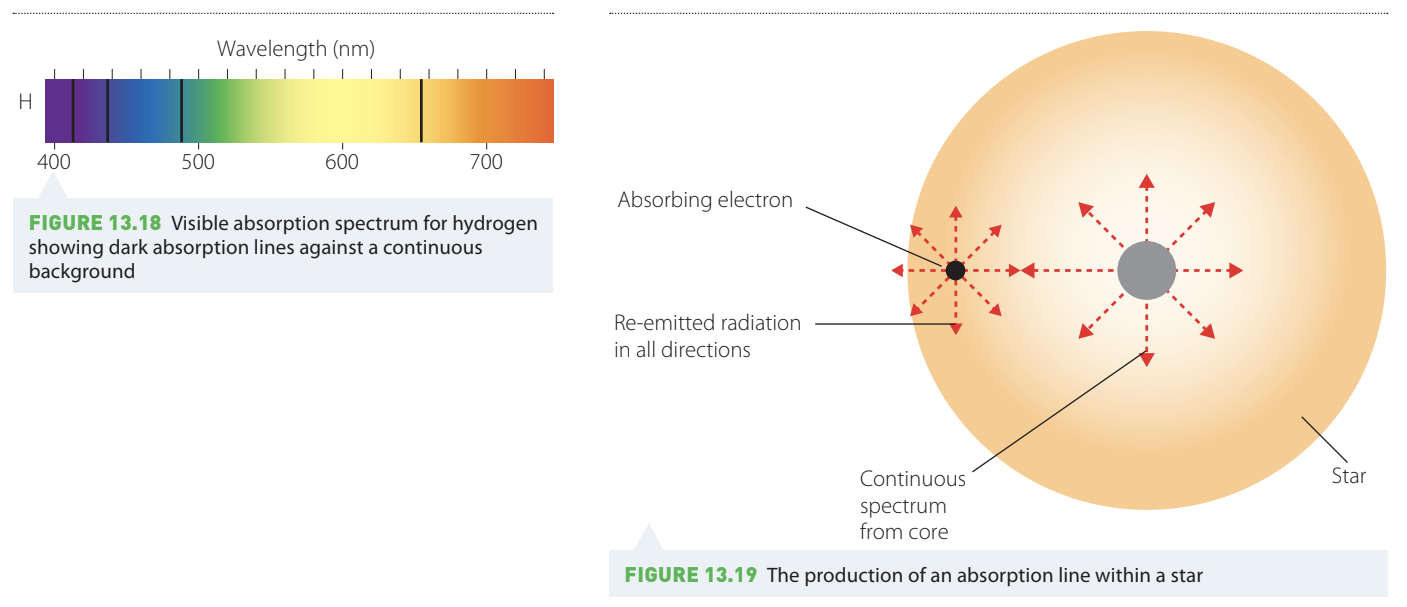
The result is that certain wavelengths appear diminished or absent in the light we receive from the star, creating dark absorption lines in the spectrum. These dark lines occur at exactly the same wavelengths as the bright emission lines would for that element. This allows astronomers to identify which elements are present in a star's atmosphere by comparing the pattern of absorption lines with laboratory spectra of known elements.
The visible absorption spectrum of hydrogen, for example, shows characteristic dark lines at specific wavelengths across the continuous background. These are the same wavelengths where hydrogen would show bright emission lines if observed in a gas discharge tube.
Memory aid: Remember "Bright lines = Emission, Dark lines = Absorption" to distinguish between the two types of line spectra.
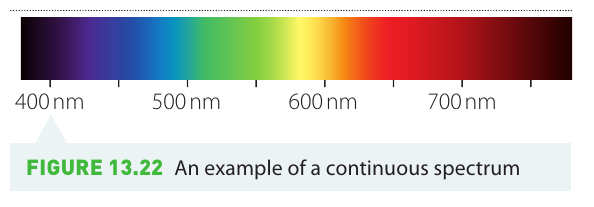
Continuous spectra
A continuous spectrum contains all wavelengths within a given range, with no gaps or lines. This type of spectrum is produced by hot, dense objects such as the tungsten filament in an incandescent light bulb or the core of a star.
Hot bodies emit radiation across a range of wavelengths, but not with equal intensity at all wavelengths. The distribution of intensity versus wavelength follows a characteristic curve called a Planck curve. As the temperature of the object increases, the peak wavelength (the wavelength at which maximum intensity occurs) becomes shorter. This causes the perceived color of the object to change from red, through orange and yellow, to white as temperature increases.
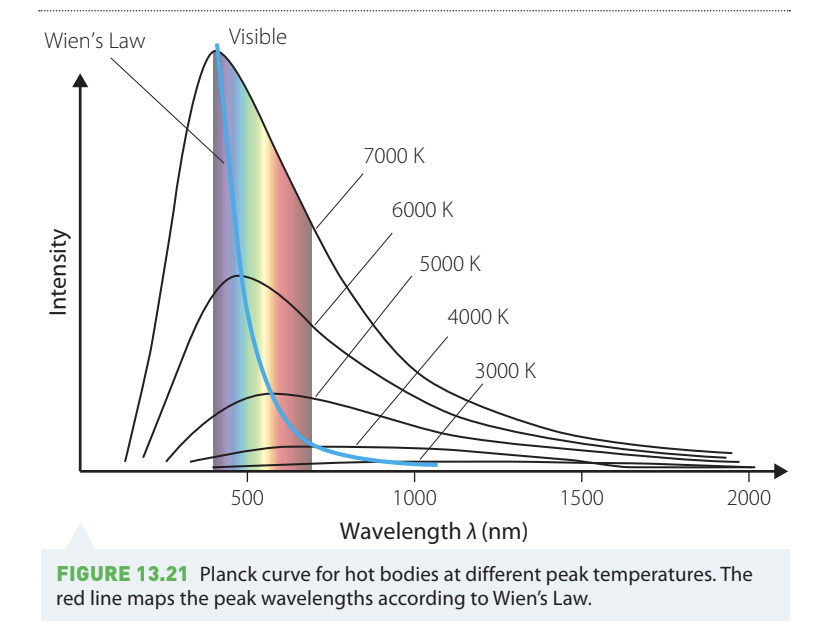
The relationship between temperature and peak wavelength is expressed quantitatively in Wien's Displacement Law:
where:
- is the peak wavelength
- mK (Wien's displacement constant)
- is the temperature in kelvin
This law explains why hot objects change color as they heat up. A relatively cool object (around 3000 K) glows red, while a hotter object (around 6000 K) appears white. The Sun's surface temperature of approximately 5800 K produces a peak wavelength in the green-yellow part of the spectrum, but we see it as white because significant amounts of blue and other colors are also emitted.
Worked Example: Applying Wien's Displacement Law
Problem: Calculate the peak wavelength emitted by a star with a surface temperature of 12,000 K.
Solution:
Using Wien's Displacement Law:
Given:
- mK
- K
Substituting:
This wavelength falls in the ultraviolet region of the spectrum, indicating this is a very hot, blue-white star.
An interesting observation is that when the peak wavelength corresponds to green, the object still appears white rather than green. This occurs because at such high temperatures, substantial amounts of blue light are also emitted. Our brain interprets this mixture of colors as white light.
Memory aid: "Hotter = Shorter wavelength" - as temperature increases, the peak wavelength shifts toward the blue (shorter wavelength) end of the spectrum.
The core of a star, where nuclei are compressed and heated to millions of degrees kelvin, is an excellent example of a source producing a continuous spectrum.
Hubble and redshift
When astronomers observe the spectra of distant galaxies, they notice something remarkable. The spectral lines are in the same relative positions as those observed in laboratory spectra, but they are shifted toward the red (longer wavelength) end of the spectrum. This phenomenon is called redshift.
The redshift occurs due to the Doppler effect. When a light source moves away from an observer, the wavelengths of the emitted light are stretched, making them longer (shifted toward red). Conversely, when a source moves toward an observer, wavelengths are compressed, making them shorter (shifted toward blue - a blueshift).
Memory aid: "RED = REceding, BLUE = BLUEing (approaching)" - redshift indicates motion away from us, while blueshift indicates motion toward us.
Edwin Hubble used this principle to measure the speeds at which distant galaxies are moving away from Earth. By comparing the wavelengths of spectral lines from distant galaxies with laboratory measurements, he could calculate their recession velocities. This work provided crucial evidence for the expansion of the Universe and contributed to the development of the Big Bang Theory.
Investigation: Investigating spectra
The following teacher demonstration allows observation and comparison of emission, absorption, and continuous spectra.
Aim: To observe and compare examples of emission, absorption and continuous spectra
Materials:
- Hand-held spectroscopes
- 12V power pack
- Induction coil
- Discharge tubes with various gas contents
- High intensity sodium vapour discharge lamp
- Incandescent globe
- Alligator leads
Safety First: This investigation involves high voltage equipment and bright light sources that can cause serious injury. This is a teacher demonstration only, and students must observe from a safe distance of at least 3 m when equipment is operating.
Risk assessment:
| What are the risks in doing this investigation? | How can you manage these risks to stay safe? |
|---|---|
| High voltage produced by an induction coil may cause a severe electric shock. | This is a teacher demonstration only. Ensure the power source is switched off at two places before handling. |
| The spark from a high voltage induction coil produces X-ray radiation. | Use for as brief a time as possible and stand back at least 3 m from the apparatus when in operation. |
| Glass discharge tubes are delicate and may break easily, releasing small shards of sharp glass. | Handle the tubes with care. |
| Glass discharge tubes may contain mercury which, once it has escaped, vaporises and may enter the lungs and bloodstream. | If a discharge tube with mercury breaks or cracks, immediately inform the laboratory managers so that it can be removed and any spillage cleaned up. |
| High intensity sodium vapour lamps emit very bright light that can harm the retina. | Do not stare at the light when in operation. |
| Observing sunlight directly through a spectroscope may cause burning of the retina and blindness. | Take great care to point your spectroscope away from the Sun. |
Method:
- With teacher guidance, connect the power pack to the induction coil and test its operation.
- Darken the room to a level where the apparatus can still be operated safely.
- Connect a gas discharge tube to the high voltage output of the induction coil and, through the spectroscope, observe the spectrum of several different gases produced.
- Observe the spectrum emitted from a sodium vapour lamp.
- Connect an incandescent globe and observe the spectrum it produces.
- Finally, go outside and observe the spectrum of reflected sunlight without directing the spectroscope towards the Sun. The spectroscope needs to be focused carefully for this part.
Results:
Sketch what you observe through the spectroscope or, if possible, photograph the spectra observed.
Discussion:
- Compare the spectra produced by each of the different gas discharge tubes. How are they similar and how are they different?
- Compare the three different types of spectra observed.
- Discuss how the way each spectrum is produced determines the type of spectrum produced.
Conclusion:
With reference to the data obtained and its analysis, write a conclusion based on the aim of this investigation.
Exam tip: Be able to explain the difference between emission and absorption spectra, and identify which type is produced by different sources. Remember that emission spectra show bright lines on dark background, while absorption spectra show dark lines on bright background.
Remember!
Key Points to Remember:
-
Dispersion separates white light into its component colors, with different wavelengths bending by different amounts through a prism.
-
Emission spectra show bright colored lines on a dark background, produced when excited gas atoms emit photons as electrons return to lower energy levels. Each element has a unique emission spectrum.
-
Absorption spectra show dark lines on a continuous bright background, produced when atoms in a star's atmosphere absorb specific wavelengths, re-emitting them in all directions.
-
Continuous spectra contain all wavelengths and are produced by hot, dense objects. Wien's Displacement Law relates peak wavelength to temperature: where mK.
-
Redshift occurs when spectral lines are shifted toward longer wavelengths due to the Doppler effect, indicating the source is moving away from the observer.
-
The energy of emitted or absorbed photons is given by:
-
Memory aids: "UP absorb, DOWN emit" for electron transitions, and "Bright lines = Emission, Dark lines = Absorption" for spectrum types.