Energy, Frequency, Wavelength, and the Hydrogen Spectrum (HSC SSCE Physics): Revision Notes
Energy, Frequency, Wavelength, and the Hydrogen Spectrum
Introduction to hydrogen spectral series
When electrons in hydrogen atoms transition between different energy levels, they emit or absorb light at specific wavelengths. These transitions create distinct patterns called spectral series. Three main series are observed in the hydrogen spectrum, each corresponding to transitions ending at different energy levels.
The table below shows the three major spectral series for hydrogen:
| Series Name | Part of Spectrum | Shortest Wavelength (nm) | Longest Wavelength (nm) |
|---|---|---|---|
| Lyman | Ultraviolet | 91.1 | 121.6 |
| Balmer | Visible | 364.5 | 656.3 |
| Paschen | Infrared | 820.1 | 1870 |
Each spectral series is named after the scientist who discovered it. The Balmer series was the first to be discovered because it produces visible light that can be seen without special equipment.
The Balmer series produces visible light and occurs when electrons fall to (or jump from) the second energy shell (). The Lyman series involves transitions to the first energy shell () and produces ultraviolet radiation. The Paschen series involves transitions to the third energy shell () and produces infrared radiation.
Energy levels in the hydrogen atom
Understanding energy level representations
Energy levels in hydrogen atoms can be represented in two different ways, both equally valid but with different reference points.
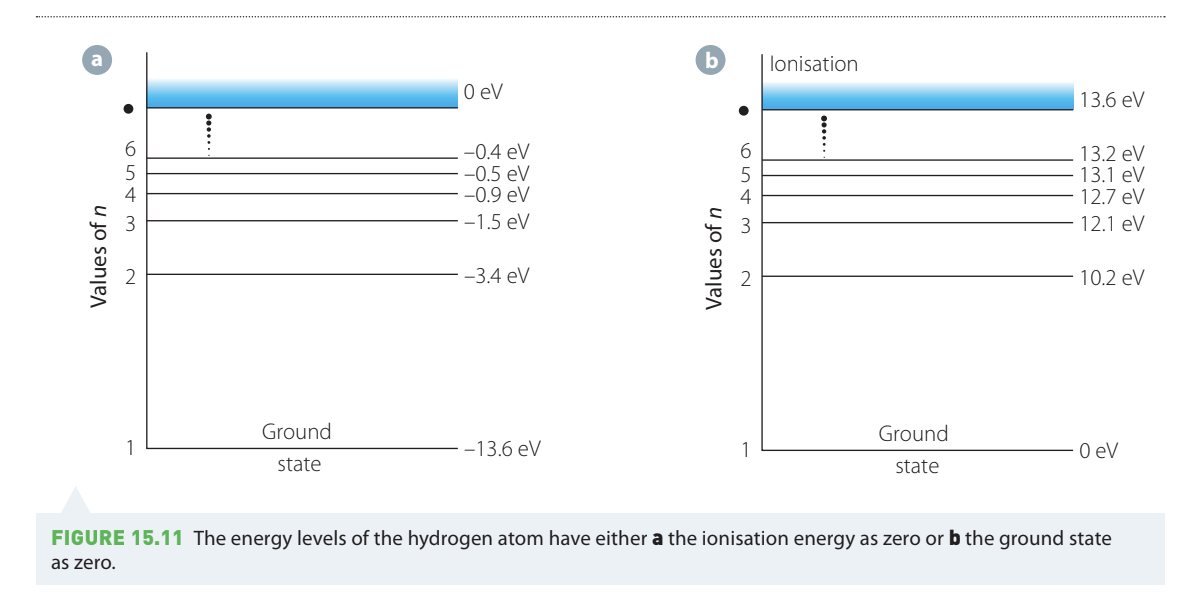
Method 1 - Ionisation energy as zero: In this representation, all energy states have negative values. The ground state (lowest energy level, ) has an energy of eV. Higher energy levels are less negative, approaching zero as the electron moves further from the nucleus. When the electron is completely removed (ionised), its energy is zero.
Method 2 - Ground state as zero: Here, the ground state is set to zero energy, and all other energy levels have positive values. The ionisation energy (energy needed to remove the electron) is eV.
In both representations, the energy difference between any two levels remains the same. The physics textbook typically uses the first method (ionisation as zero) because it aligns with standard conventions in electromagnetism.
Key terms
Ground level (ground state): The lowest possible energy level in an atom, corresponding to the electron being in the orbit with the smallest radius. For hydrogen, this is the level.
Ionisation: The process of removing an electron from an atom completely, so it is infinitely far away (or far enough that electrostatic attraction becomes negligible).
Energy transitions and spectral lines
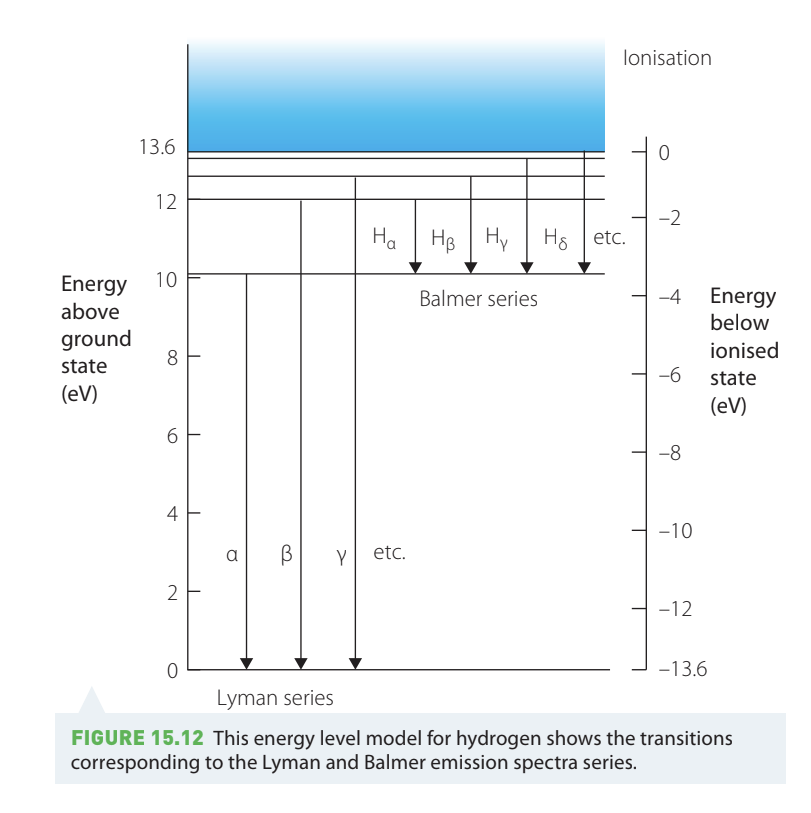
The diagram above shows how different spectral series arise from electron transitions. The Lyman series (with lines labelled , , , etc.) corresponds to electrons falling to the ground state (). The Balmer series (with lines labelled , , , , etc.) corresponds to electrons falling to the level.
The labels using Greek letters identify individual spectral lines within each series, starting with the line having the longest wavelength (lowest energy transition). For example, (H-alpha) is the longest wavelength line in the Balmer series, corresponding to the transition from to .
The energy of a photon
When an electron moves between energy levels, it either absorbs or emits a photon. The energy of this photon is directly related to its frequency through Planck's equation:
where:
- = energy in joules (J) or electron-volts (eV)
- = Planck's constant = J·s or eV·s
- = frequency of the photon in hertz (Hz)
Important unit conversion: The electron-volt (eV) is commonly used in atomic physics:
When an electron transitions from a higher energy level (initial, ) to a lower level (final, ), the energy difference appears as a photon:
Worked Example: Calculating Photon Frequency
Problem: An electron falls from to , releasing J of energy. What is the frequency of the emitted light?
Solution:
Given:
- J
- J·s
Using , rearrange for frequency:
Substitute values:
This frequency corresponds to visible light in the Balmer series.
The relationship between energy and wavelength
For electromagnetic waves, the speed of light (), frequency (), and wavelength () are related by:
For light, m/s, so:
Combining this with gives us another useful relationship:
This equation connects photon energy directly to wavelength, which is often easier to measure experimentally than frequency. Wavelength can be measured using diffraction gratings or spectrometers, while frequency must typically be calculated from wavelength.
Worked Example: Calculating Energy from Wavelength
Problem: An electron transition produces a photon with wavelength 1094 nm. What is the energy difference between the two shells?
Solution:
Given:
- nm m
- J·s
- m/s
Using :
Rydberg's equation
Historical context
In the 1880s, Johannes Rydberg developed a mathematical formula that accurately predicted the wavelengths of spectral lines in hydrogen. He derived this equation empirically - meaning he fitted it to observed data rather than deriving it from a theoretical model. At that time, no atomic theory could explain why spectral lines existed at all. Rydberg's work was crucial in leading to the development of the Bohr model of the atom.
Rydberg's achievement was remarkable because he created a mathematical pattern that worked perfectly without understanding the underlying physics. This is a great example of how empirical observations can guide theoretical development in science.
The Rydberg formula
The Rydberg equation predicts the wavelength of emission and absorption lines for hydrogen:
where:
- = wavelength of the spectral line
- = Rydberg constant m
- = final energy level (an integer: 1, 2, 3, ...)
- = initial energy level (an integer greater than )
For different series:
- Lyman series: (transitions to ground state)
- Balmer series: (transitions to first excited state)
- Paschen series: (transitions to second excited state)
Important limitation: The Rydberg equation only works accurately for hydrogen. It does not apply to atoms with multiple electrons because electron-electron interactions complicate the energy level structure.
Worked Example: Finding Wavelength Using Rydberg's Equation
Problem: Find the wavelength of a photon emitted when an electron in hydrogen makes the smallest energy transition in the Paschen series.
Solution:
The Paschen series has . The smallest energy transition occurs between adjacent levels, so .
Given:
- m
Using Rydberg's equation and rearranging for :
Substitute values:
This wavelength falls in the infrared region of the spectrum, as expected for the Paschen series.
Worked Example: Finding Initial Energy Level
Problem: A hydrogen emission line has wavelength m in the infrared. If the final energy shell is , from which energy shell did the electron fall?
Solution:
Given:
- m
- m
Start with Rydberg's equation:
Rearrange to solve for :
Substitute values:
The electron fell from the fourth energy level () to the third level ().
Conservation of energy in atomic transitions
The law of conservation of energy states that energy cannot be created or destroyed, only transformed from one form to another. This fundamental principle applies to electron transitions in atoms.
When an electron falls from a higher energy level to a lower one, it loses energy. This lost energy doesn't disappear - it is transformed into a photon of electromagnetic radiation. The energy of the photon exactly equals the energy difference between the two levels:
Conversely, when an atom absorbs a photon, the electron gains energy and jumps to a higher level. The photon's energy must exactly match the energy difference between levels for absorption to occur.
This explains why emission and absorption spectra for a given element show lines at identical wavelengths - they represent the same energy differences, just in opposite directions. This is why astronomers can identify elements in distant stars by analyzing the light they emit or absorb.
Exam tips
Formula selection:
- Use when you know or need frequency
- Use when you know or need wavelength
- Use Rydberg's equation when dealing with specific energy level transitions in hydrogen
Unit conversions:
- Always convert wavelengths to metres before calculations
- Remember: 1 nm = m
- Watch for energy in eV vs J - use the appropriate value of Planck's constant
Significant figures:
- Energy level numbers () are exact, so don't limit your significant figures based on them
- Match significant figures to the given constants (usually 3-4 significant figures)
Common mistakes to avoid:
- Forgetting to square the energy level numbers in Rydberg's equation
- Mixing up and (initial must be higher than final for emission)
- Using the wrong units for Planck's constant (J·s vs eV·s)
- Forgetting to convert wavelength from nanometres to metres
Key Points to Remember:
- Three spectral series: Lyman (, UV), Balmer (, visible), Paschen (, infrared)
- Energy-frequency relationship: where J·s
- Energy-wavelength relationship: connects photon energy to wavelength
- Rydberg equation: predicts hydrogen spectral line wavelengths, where m
- Conservation of energy: Energy lost by an electron during a transition equals the energy of the emitted photon; energy absorbed from a photon equals the energy gained by the electron
- Wavelength and energy are inversely related: Shorter wavelengths correspond to higher energy photons
- Each spectral line represents a specific energy transition between two quantized energy levels