The Electromagnetic Spectrum (HSC SSCE Physics): Revision Notes
The Electromagnetic Spectrum
Introduction
The electromagnetic spectrum is the complete range of electromagnetic radiation, organized by frequency and wavelength. Understanding how light behaves in different materials and how atoms interact with light helps us identify elements and understand the nature of electromagnetic radiation.
The study of electromagnetic radiation bridges multiple areas of physics - from optics and atomic structure to astronomy and quantum mechanics. The techniques developed through spectroscopy allow scientists to analyze the composition of distant stars and galaxies without ever visiting them.
Refractive index
Light travels at different speeds in different materials. In a vacuum, light travels at its maximum speed of m/s. However, when light enters a material such as water or glass, it slows down due to interactions with the atoms in the material.
The refractive index () measures how much a material slows down light. It is defined as the ratio of the speed of light in a vacuum to the speed of light in the material:
where:
- is the refractive index (no units)
- is the speed of light in a vacuum ( m/s)
- is the speed of light in the material (m/s)
A higher refractive index means light travels more slowly in that material. The refractive index is always greater than or equal to 1, with air having a value very close to 1. This is because nothing can travel faster than light in a vacuum.
Refractive indices of common materials
The following table shows how different materials affect the speed of light:
| Material | Refractive index |
|---|---|
| Air | 1.0003 |
| Water | 1.33 |
| Ethanol | 1.36 |
| Zircon | 1.92 |
| Diamond | 2.42 |
Notice that diamond has the highest refractive index among common materials, meaning light travels slowest in diamond - only about 41% of its vacuum speed.
Worked Example: Speed of light in ethanol
Question: What is the speed of light in ethanol?
Solution:
From the table, ethanol has a refractive index of .
Starting with the refractive index formula:
Rearranging to solve for :
Substituting the values:
Answer: Light travels at m/s in ethanol, which is slower than in a vacuum.
Dispersion
The refractive index of a material actually varies with the wavelength of light. This means different colours of light travel at slightly different speeds in the same material and refract by different amounts.
When white light passes through a prism or water droplet, this variation causes the different colours to separate and spread out. This phenomenon is called dispersion. It is responsible for creating rainbows and the coloured spectrum we see when white light passes through a prism.
Dispersion occurs because the refractive index is wavelength-dependent. Shorter wavelengths (blue and violet light) typically have higher refractive indices than longer wavelengths (red light), causing them to refract more strongly. This is why blue light bends more than red light when passing through a prism.
The electromagnetic spectrum
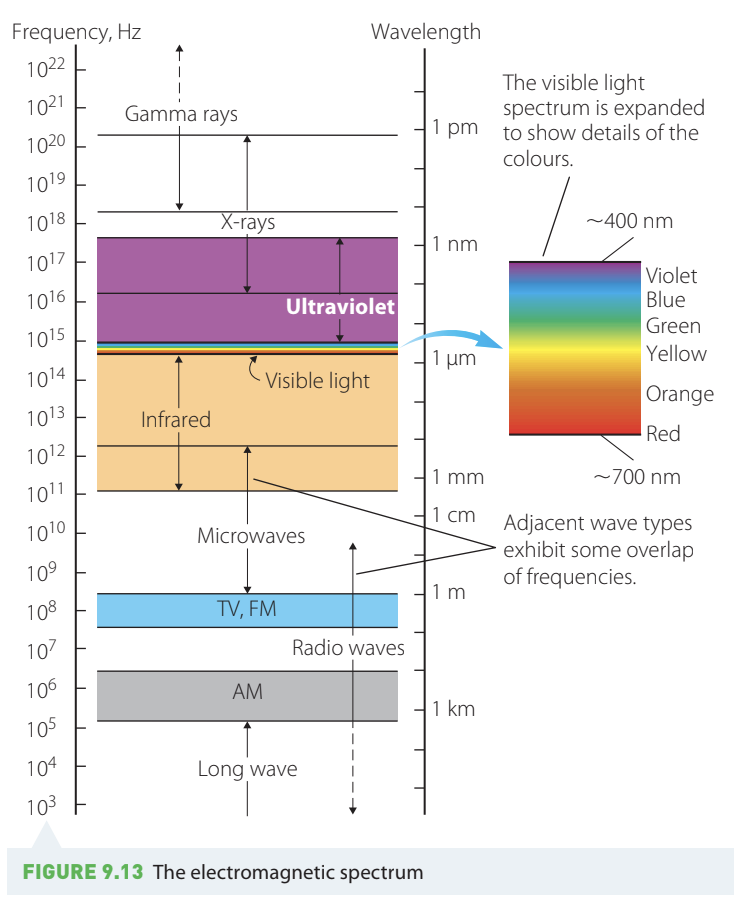
When electromagnetic radiation is arranged by frequency or wavelength, we get the electromagnetic spectrum. This spectrum includes all types of electromagnetic radiation, from low-frequency radio waves to high-frequency gamma rays.
Memory Aid for EM Spectrum Order
Remember the order from lowest to highest frequency using this mnemonic:
"Radio Men In Venice Use X-ray Goggles"
- Radio waves
- Microwaves
- Infrared
- Visible light
- Ultraviolet
- X-rays
- Gamma rays
Types of electromagnetic radiation
The electromagnetic spectrum includes (from lowest to highest frequency):
- Radio waves - Longest wavelengths (kilometres to metres). Used for radio and television broadcasting. Frequencies from to Hz.
- Microwaves - Wavelengths of centimetres to millimetres. Used in microwave ovens and satellite communications. Frequencies around to Hz.
- Infrared radiation - Wavelengths from about 1 mm to 700 nm. Felt as heat. Used in thermal imaging and remote controls. Frequencies from to Hz.
- Visible light - The only part of the spectrum our eyes can detect. Wavelengths from about 400 nm (violet) to 700 nm (red). Frequencies from to Hz. This narrow band contains all the colours we see: red, orange, yellow, green, blue, and violet.
- Ultraviolet (UV) radiation - Wavelengths shorter than visible light, from about 400 nm down to 1 nm. Can cause sunburn. Frequencies from to Hz.
- X-rays - Very short wavelengths (1 nm to 1 pm). Used in medical imaging and security scanning. Frequencies from to Hz.
- Gamma rays - Shortest wavelengths (less than 1 pm). Produced by radioactive materials and cosmic events. Frequencies above Hz.
Note that adjacent wave types overlap in their frequency ranges, and there are no sharp boundaries between categories. The divisions are somewhat arbitrary and based on how we use or detect these different types of radiation.
The visible spectrum
The visible light portion of the spectrum is the narrow range that human eyes can detect. It extends from violet light (around 400 nm) to red light (around 700 nm). The colours in order of increasing wavelength are:
- Violet (shortest wavelength, ~400 nm)
- Blue
- Green
- Yellow
- Orange
- Red (longest wavelength, ~700 nm)
ROYGBIV is a helpful mnemonic for remembering the visible spectrum colors in order of increasing wavelength: Red, Orange, Yellow, Green, Blue, Indigo, Violet.
White light is a mixture of all these colours. When white light is dispersed by a prism, it separates into these component colours.
Spectral lines and identifying elements
Spectroscopy is the study of how electromagnetic radiation interacts with matter. It has become one of the most powerful tools in science, allowing us to identify elements in stars, distant galaxies, and laboratory samples.
Historical development
In 1802, English physician William Wallace Hyde noticed dark lines in the Sun's spectrum. German physicist Joseph von Fraunhofer catalogued about 500 of these lines in 1814 and found that the spectrum of Venus matched that of the Sun. He also observed spectra from many stars.
From around 1848, scientists including Foucault, Bunsen, and Kirchhoff identified various solar spectral lines with the known emission lines of different elements. This proved that the same elements found on Earth also exist in the Sun and other stars.
The photon model of light
To understand spectral lines, we need to think of light as consisting of particles called photons. Each photon carries a specific amount of energy related to its frequency by the equation:
where:
- is the photon energy (in joules or electron volts)
- is Planck's constant ( J·s)
- is the frequency (in Hz)
Since frequency and wavelength are related by , we can also write:
This equation shows that photons with shorter wavelengths (higher frequencies) carry more energy. This is why ultraviolet light can cause sunburn while visible light cannot - UV photons have enough energy to damage biological molecules.
Electron energy levels
Every electron in an atom occupies a specific energy level or shell. The lowest energy level is called the ground state. Electrons in the ground state are stable and do not radiate energy.
However, if a photon with exactly the right energy interacts with an electron, the electron can absorb that energy and jump to a higher energy level. The electron is then in an excited state, which is unstable.
The excited electron will eventually fall back down to a lower energy level, releasing the absorbed energy as a photon. The energy of this emitted photon exactly equals the energy difference between the two levels.
Understanding Electron Transitions
Think of electron energy levels like steps on a staircase:
- Absorption: The electron "climbs up" the stairs by absorbing a photon with exactly the right energy
- Emission: The electron "falls down" the stairs, releasing a photon with energy equal to the height difference
For example, in a hydrogen atom:
- The single electron normally sits in the first shell (ground state)
- If it absorbs a photon with the right energy, it can jump to the second, third, fourth, or higher shells
- When it falls back down, it emits a photon with energy equal to the difference between the shells
Absorption and emission spectra
There are two types of line spectra we can observe:
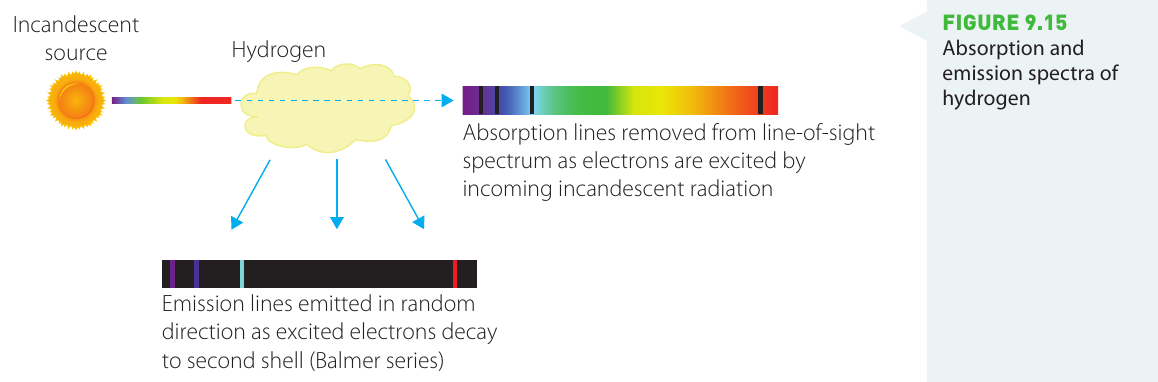
Absorption lines: When white light from an incandescent source (like a hot filament or star) passes through a cool gas, atoms in the gas absorb photons at specific frequencies. These missing frequencies appear as dark lines in an otherwise continuous spectrum. The atoms absorb photons that have exactly the right energy to promote their electrons to higher energy levels.
Emission lines: When we view a sample of excited gas atoms from an angle (not looking at the background source), we see bright coloured lines on a dark background. These emission lines are produced when excited electrons fall back to lower energy levels and emit photons in random directions.
Critical Concept: Spectral Fingerprints
Both absorption and emission lines occur at exactly the same wavelengths for a given element. Every element has its own unique pattern of spectral lines, like a fingerprint. This allows us to identify elements even in distant stars and galaxies billions of light-years away.
This is one of the most powerful applications of spectroscopy - we can determine the chemical composition of objects we can never physically reach or sample.
Incandescent sources
An incandescent source is one that produces light by being heated, such as:
- A tungsten filament in a light bulb
- The surface of a star
- A hot metal object
Incandescent sources produce a continuous spectrum containing all wavelengths, with the peak wavelength depending on temperature. Hotter objects emit more blue light, while cooler objects emit more red light. Our Sun appears white because its peak wavelength is in the green region, but it emits significant amounts of blue light as well, which our brain interprets as white.
The Balmer series
The Balmer series refers to a specific set of visible emission lines from hydrogen. These lines are produced when excited electrons fall from higher shells down to the second shell ().
| Transition | Colour | Wavelength (nm) |
|---|---|---|
| 3 → 2 | Red | 656.3 |
| 4 → 2 | Aqua | 486.1 |
| 5 → 2 | Blue | 434.1 |
| 6 → 2 | Violet | 410.2 |
These are the main visible spectral lines of hydrogen and are easily observed in laboratory experiments and astronomical observations.
Worked Example: Photon energy in the Balmer series
Question: What is the energy of the photon emitted when an electron transitions from shell 3 to shell 2 in hydrogen? Express your answer in electron volts (eV), where 1 eV = J.
Given information:
- Wavelength: nm (from the Balmer series table)
- Planck's constant: J·s
- Speed of light: m/s
Solution:
We use the formula linking energy, frequency and wavelength:
First, convert the wavelength to metres:
Now substitute the values:
Converting to electron volts:
Answer: The photon energy for the red Balmer line is 1.89 eV.
Investigation: Visible spectral lines
Aim
To examine various spectra produced by discharge tubes, reflected sunlight, and incandescent filaments.
Materials
- Hand-held spectroscope
- Induction coil
- 12V incandescent globe
- 12V power supply
- Leads and alligator clips
- Discharge tubes containing different gases (sodium, mercury)
Risk assessment
Critical Safety Notes
- Never look directly at the Sun through the spectroscope - this can cause permanent eye damage
- When observing sunlight, use reflection from a white wall only
- Stand at least 3 metres away from operating discharge tubes to avoid X-ray exposure
- Ensure discharge tubes are properly secured and connections are insulated
Method
- Set up the induction coil and discharge tubes in a darkened room.
- Observe the spectrum produced by each discharge tube using the hand-held spectroscope. Sketch your observations, noting the colours and positions of the emission lines.
- Observe the spectrum produced by a fluorescent light and compare it with those from the discharge tubes. Note similarities and differences.
- Connect the 12V incandescent globe to the power supply. Observe its spectrum without other light sources present. Try different voltage settings and note how changes in temperature affect both the intensity and the range of colours produced.
- Go outside and observe the spectrum from reflected sunlight using a white wall. Ensure the spectroscope is carefully focused. Compare this with the other spectra you observed.

Expected observations
- Discharge tubes: You should see bright emission lines at specific wavelengths, unique to each gas. Mercury, for example, produces distinct violet, blue, green, yellow, and red lines.
- Fluorescent light: Similar to discharge tubes, showing emission lines from the mercury vapour inside.
- Incandescent globe: A continuous spectrum containing all colours. As voltage (and temperature) increases, the light becomes brighter and whiter as more blue light is produced.
- Sunlight: A continuous spectrum with dark absorption lines (Fraunhofer lines) where elements in the Sun's atmosphere have absorbed specific wavelengths.
Discussion
The differences between these spectra demonstrate:
- Incandescent sources produce continuous spectra
- Gas discharge tubes produce line emission spectra characteristic of the element
- The Sun's spectrum shows both continuous and absorption features
These observations confirm that each element has a unique spectral signature that can be used for identification. This is the fundamental principle behind astronomical spectroscopy - by analyzing the spectral lines in starlight, we can determine what elements are present in distant stars and galaxies.
Key Concepts to Remember
-
The refractive index () measures how much a material slows down light. A higher refractive index means slower light speed. Remember: n is always ≥ 1.
-
Dispersion occurs because refractive index varies with wavelength, causing different colours to refract by different amounts and separate when passing through a prism. This creates rainbows and spectral separation.
-
The electromagnetic spectrum spans from low-frequency radio waves to high-frequency gamma rays. Visible light is just a tiny portion of this spectrum, ranging from 400 nm (violet) to 700 nm (red).
-
Mnemonic for EM spectrum: "Radio Men In Venice Use X-ray Goggles"
-
Photons carry energy given by . Shorter wavelengths mean higher energy.
-
Electron transitions:
- Absorption = electrons moving UP to higher energy levels (absorbing photons)
- Emission = electrons falling DOWN to lower levels (releasing photons)
-
Absorption lines (dark lines in a continuous spectrum) and emission lines (bright lines on a dark background) occur at the same wavelengths for each element, providing a unique spectral fingerprint for element identification.
-
The Balmer series of hydrogen consists of visible emission lines produced when electrons fall to the second shell, with the red line at 656.3 nm being the most prominent.
-
Spectroscopy allows us to identify elements in distant astronomical objects by analyzing their unique spectral patterns.