Pitch and Loudness (HSC SSCE Physics): Revision Notes
Pitch and Loudness
What are pitch and loudness?
When you listen to any sound, you immediately notice two important characteristics: the pitch of the sound and its loudness. Pitch describes how high or low a note sounds on the musical scale, while loudness describes how quiet or loud the sound appears to your ears.
To understand these characteristics scientifically, we need to be able to visualize the sound waves that produce the sounds we hear. This allows us to analyze and measure the properties of sound waves.
Visualising sound waves with an oscilloscope
An oscilloscope is a device that displays how electrical signals change over time on a screen. When we want to study sound waves, we use a microphone to convert the energy of sound waves into electrical signals. These electrical signals can then be sent to an oscilloscope for display and analysis.
On an oscilloscope display:
- The vertical axis represents the amplitude (pressure variations) in the sound waves
- The horizontal axis represents time
An oscilloscope displays a graph of amplitude versus time. It is not showing you a snapshot of the wave at one particular moment. Instead, it shows how the amplitude changes at one location as time passes.
The oscilloscope appears to show a transverse wave pattern, even though sound waves are actually longitudinal. This is because the vertical axis represents how much particles move at a specific point, whilst the horizontal axis represents time.
Setting up to investigate sound waves
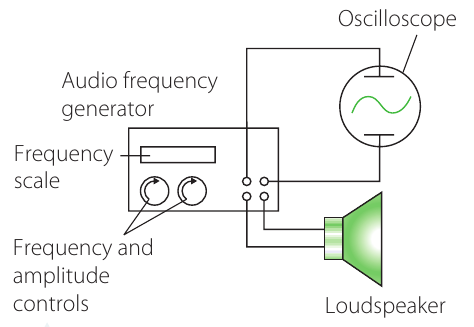
We can use three pieces of equipment together to investigate sound wave properties:
- An audio frequency generator - produces sounds of known frequency
- A loudspeaker - makes the sound audible
- An oscilloscope - displays the waveform
The audio generator vibrates the loudspeaker to produce sound. Some of this sound vibrates your eardrums (so you hear it), whilst some vibrates a microphone. The microphone converts these vibrations into an electrical signal that feeds into the oscilloscope for display.
The relationship between pitch and frequency
The pitch you hear is directly related to the frequency of the sound wave.
- Higher frequency → Higher pitch
- Lower frequency → Lower pitch
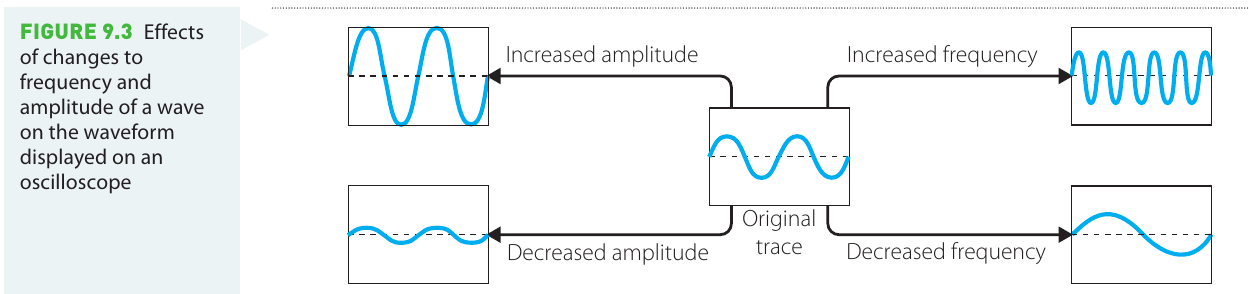
When you increase the frequency of a sound wave, the waveform on the oscilloscope appears more "bunched up" or compressed. This is because more wave cycles fit into the same time period.
The relationship between loudness and amplitude
The loudness you perceive is related to the amplitude of the sound wave.
- Greater amplitude → Louder sound
- Smaller amplitude → Quieter sound
When you increase the amplitude of a sound wave, the waveform on the oscilloscope becomes taller. The peaks reach higher and the troughs go deeper.
Calculating period and frequency from oscilloscope displays
Understanding the time-base scale
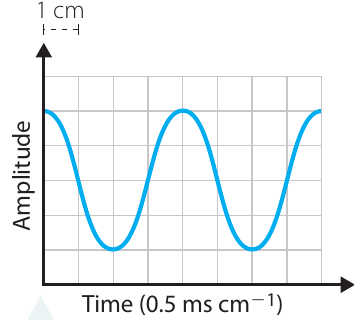
The time-base scale is the calibration of the horizontal axis on the oscilloscope. It tells you how much real time each centimetre on the screen represents. For example, if the time-base scale is set to , then each centimetre on the horizontal axis represents milliseconds.
Measuring the period
The period () is the time taken for one complete wave cycle. To find the period from an oscilloscope display:
- Measure the horizontal distance (in cm) between two successive crests (or troughs)
- Multiply this distance by the time-base scale setting
Calculating frequency from period
Once you know the period, you can calculate the frequency () using:
where:
- = frequency in hertz (Hz)
- = period in seconds (s)
Alternative frequency formula
You can also calculate frequency as the number of wave cycles passing in a given time:
where:
- = number of wave cycles
- = time taken
When using , make sure to convert the period to seconds before calculating. If your period is in milliseconds, multiply by to convert to seconds.
Worked example
Worked Example: Calculating frequency from oscilloscope data
Question: An oscilloscope has the time axis scale set to . A sound wave is received by a microphone connected to the oscilloscope's input. The distance between two successive crests on the screen is cm. Find the period, , and the frequency, , of the sound wave.
Solution:
Given information:
- Time-base scale =
- Distance between crests = cm
Step 1: Calculate the period
Step 2: Calculate the frequency
Answer: The period is ms and the frequency is Hz.
Investigation 9.1: Pitch, frequency, loudness and amplitude of sound waves
Aim
To investigate the relationship between pitch and frequency as well as loudness and amplitude of sound waves.
Before beginning, you should write a hypothesis as an "If... then..." statement. For example: "If the frequency increases, then the pitch will increase."
Materials
- Audio signal generator
- Oscilloscope (or equivalent tablet/phone app)
- Loudspeaker (such as computer speakers)
Risk assessment
Safety Considerations:
| What are the risks? | How can you manage them? |
|---|---|
| Devices plugged into 240 V mains power are a potential source of electric shock | Devices should be kept well away from water and should have been tested and tagged |
Consider any other risks specific to your setup and how to manage them safely.
Method
- Connect the apparatus as shown in the diagram below.
- Practice using the features of your oscilloscope, as different models vary considerably in their controls.
- Set the audio generator to produce a Hz sound wave. Measure the horizontal distance of one complete wavelength on the oscilloscope display. Calculate the period, , using the method shown previously. You will need to know the time-base scale setting on your oscilloscope.
- Gradually increase the frequency on the audio generator while observing:
- The change to the waveform displayed on the oscilloscope
- The change in pitch of the sound being heard
- Next, vary the output level (amplitude) from the audio generator, again while observing:
- The change to the shape of the waveform displayed
- The change to the perceived loudness of the sound being heard
Results
Record your observations in writing:
- Describe the change in the waveform shape and the change in the perceived sound as the frequency was increased.
- Describe the change in the waveform shape and the change in the perceived sound as the output level was varied.
Analysis of results
From your observations, deduce the relationships:
- Between pitch and frequency
- Between loudness and amplitude
Summarize your findings clearly.
Discussion
Consider how these relationships might extend to other types of waves, such as light waves or earthquake waves. Think about whether similar principles apply.
Conclusion
Write a conclusion that refers back to your original hypothesis. State whether your hypothesis was supported by the data you collected.
Investigation 9.2: Measuring the frequency of a sound wave
Aim
To measure the frequency of a sound wave using an oscilloscope.
Materials
- Oscilloscope
- Three tuning forks of different frequencies with sounding boards
- Microphone
Risk assessment
Safety Considerations:
| What are the risks? | How can you manage them? |
|---|---|
| Devices plugged into 240 V mains supply are a potential source of electric shock | Devices should be kept well away from water and should have been tested and tagged |
Method
- Set up the oscilloscope and adjust the display controls so that when a tuning fork is sounded near the microphone, a steady waveform appears on the screen. Adjust the time-base (horizontal axis) input scale to achieve this.
- Measure the distance on the screen from one crest to the next crest. Convert this distance to the period using the time-base scale.
- Record your results in a data table with the following columns:
| Tuning fork | Time-base setting (ms cm⁻¹) | Crest to crest distance (cm) | Period (ms) | Frequency (Hz) |
|---|---|---|---|---|
- Repeat this procedure for the other tuning forks.
- Calculate the frequency of each tuning fork using .
- Compare your calculated frequencies with the frequencies stamped on the tuning forks themselves.
Analysis of results
After completing your measurements, consider these questions:
- What relationship did you observe between the frequencies of the tuning forks and the pitch you heard?
- Describe how the amplitude of the displayed wave changed as the loudness of the sound from the sounding boards changed (as the sound died away).
- Was there any relationship observed between frequency and amplitude?
Key Formulas Summary:
Period from oscilloscope display:
Frequency from period:
Frequency from wave count:
Where:
- = period (time for one complete wave cycle)
- = frequency (number of cycles per second)
- = number of wave cycles
- = time taken
Key Points to Remember:
- Pitch relates to frequency: Higher frequency produces higher pitch sounds, lower frequency produces lower pitch sounds.
- Loudness relates to amplitude: Greater amplitude produces louder sounds, smaller amplitude produces quieter sounds.
- Oscilloscopes display amplitude versus time: The vertical axis shows amplitude (pressure variations) and the horizontal axis shows time. It's not a snapshot of the wave.
- Use the time-base scale to find period: Multiply the distance between successive crests (in cm) by the time-base scale setting to get the period.
- Calculate frequency using : Frequency is the reciprocal of period. Make sure to convert period to seconds before calculating.