Introduction to Transition Matrices (VCE SSCE General Mathematics): Revision Notes
Introduction to Transition Matrices
A transition matrix is a powerful mathematical tool that helps us track and predict how things move or change between different states over time. Think of it as a way to organise probabilities about what happens next based on what's happening now.
Transition matrices are used in many real-world applications, from predicting customer behavior and weather patterns to modeling population movements and game strategies. Understanding how to read and interpret these matrices is a valuable skill across many fields.
What is a transition matrix?
Let's explore this concept with a practical example. Imagine tracking people's Saturday night activities in a town where there are two options:
- Going to the movies (M)
- Staying at home (S)
Research shows that:
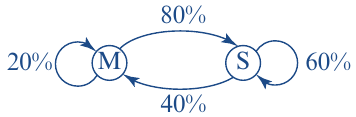
- 20% of people who go to the movies this Saturday will go again next Saturday (meaning 80% will stay home next Saturday)
- 40% of people who stay home this Saturday will go to the movies next Saturday (meaning 60% will stay home again next Saturday)
This information can be shown visually as a transition diagram:
The same information can also be organised as a transition matrix. Notice that percentages are converted to decimals (20% = 0.2, 80% = 0.8, etc.):
The columns represent the current state (this Saturday), and the rows show the probabilities of transitioning to each state next Saturday. This structure is crucial for reading and interpreting the matrix correctly.
Properties of transition matrices
Transition matrices have two important properties that you should always check:
Property 1: Square matrix
A transition matrix is always a square matrix. This means it has the same number of rows as columns (in our example, it's a matrix because we have two possible states).
Property 2: Column totals equal 1
Each column in a transition matrix must sum to exactly 1 (or 100% if using percentages). This makes sense because the probabilities represent all possible outcomes—someone must do something next week, so the probabilities must add up to certainty.
For example, in our movies/home matrix:
- First column: ✓
- Second column: ✓
This is a critical property to verify when setting up or checking a transition matrix.
Setting up a transition matrix
Let's work through how to construct a transition matrix from given information.
Worked Example: Amusement Park Rides
An amusement park has two rides for pre-school children: the Ferris wheel (F) and the Merry-go-round (M). After each ride, children choose which ride they want next. The park observes:
- 70% of children on the Ferris wheel will ride it again
- 40% of children on the Merry-go-round will ride it again
Part a: Find the percentage of children on the Ferris wheel who will go on the Merry-go-round next time.
Solution:
Children on the Ferris wheel either go on the Ferris wheel again or switch to the Merry-go-round. These percentages must add to 100%.
Therefore:
30% of children will go on the Merry-go-round next time.
Part b: Find the percentage of children on the Merry-go-round who will go on the Ferris wheel next time.
Solution:
Similarly, children on the Merry-go-round either stay or switch to the Ferris wheel. These must add to 100%.
Therefore:
60% of children will go on the Ferris wheel next time.
Part c: Construct a transition matrix for this situation.
Solution:
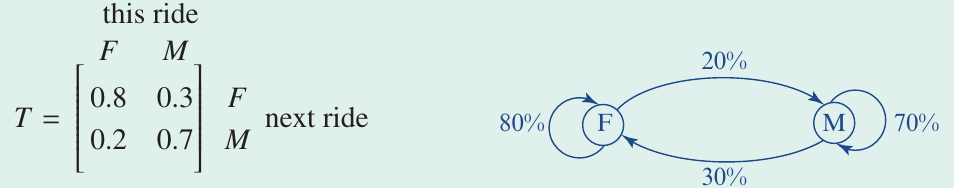
We set up the matrix with F and M representing the two rides. The matrix shows transitions from "this ride" to "next ride".
The first column represents children currently on the Ferris wheel:
- stay on Ferris wheel (top row)
- move to Merry-go-round (bottom row)
The second column represents children currently on the Merry-go-round:
- move to Ferris wheel (top row)
- stay on Merry-go-round (bottom row)
We can verify this is correct by checking column totals: ✓ and ✓
The transition diagram for this situation looks like:
Interpreting and applying transition matrices
Once we have a transition matrix, we can use it to make predictions. The key is understanding how to read the matrix correctly.
How to read a transition matrix:
- Each column represents the current state
- Each row shows where things transition to
- Read down a column to see all possible outcomes from that starting state
Let's see this in action with a detailed worked example.
Worked Example: Predicting Ride Choices
The following transition matrix describes children's movement between the Ferris wheel (F) and Merry-go-round (M):
Part a: What percentage of children on the Ferris wheel are predicted to go on the:
- (i) Ferris wheel next time?
- (ii) Merry-go-round next time?
Solution:
We read from the first column of the transition matrix (this represents children currently on F):
(i) Look at the first row, first column:
(ii) Look at the second row, first column:
Part b: If 140 children went on the Ferris wheel, how many do you expect to go on the:
- (i) Ferris wheel next time?
- (ii) Merry-go-round next time?
Solution:
We multiply the transition probabilities by the number of children.
(i) Ferris wheel next time:
We expect 112 children from the Ferris wheel to ride it again next time.
(ii) Merry-go-round next time:
We expect 28 children from the Ferris wheel to switch to the Merry-go-round next time.
Part c: If 140 children went on the Ferris wheel and 80 children went on the Merry-go-round, how many children do you predict will go on the Ferris wheel next time?
Solution:
We need to consider children coming to the Ferris wheel from both rides.
From the Ferris wheel (calculated above): 112 children
From the Merry-go-round: We use the second column to find that 30% of Merry-go-round riders switch to the Ferris wheel.
Total prediction for Ferris wheel next time:
We predict that 136 children will go on the Ferris wheel next time.
This example shows how transition matrices allow us to make predictions about future states based on current numbers and established patterns of behaviour.
Exam tip: Always double-check your transition matrix by verifying that each column sums to 1.0. This simple check can catch many errors in matrix setup.
Remember!
Key Points to Remember:
- A transition matrix is always a square matrix that shows probabilities of moving between different states.
- Each column total must equal 1 (or 100%) because all possibilities must be accounted for.
- To read a transition matrix: columns represent the current state, rows show where transitions lead to.
- Always convert percentages to decimals when setting up a matrix (80% = 0.8).
- To make predictions: multiply the transition probability by the number in the current state, then add contributions from all starting states.