Combining Events (VCE SSCE Mathematical Methods): Revision Notes
Combining Events
Introduction to sets and set notation
Before working with combined probability events, we need to understand some fundamental concepts from set theory. Sets provide a precise mathematical language for describing groups of outcomes and how they relate to each other.
The empty set, denoted by , is a set with no elements at all. This is different from , which contains one element (the number zero).
The universal set, denoted by , represents all possible outcomes in a particular situation. In Venn diagrams, we show the universal set as a rectangle, with subsets drawn as circles inside it.
Venn diagrams are visual tools that help us understand relationships between sets. They make it much easier to see how different groups overlap and interact.
Understanding set notation is essential for probability because it gives us a precise way to describe events and their relationships. Every probability problem involves a universal set (all possible outcomes) and various subsets representing different events.
Set operations
Union
When we want to combine two sets to include everything in either set, we use the union operation.
The union of sets and , written as , contains all elements that are in or in (or in both). Think of this as "everything that belongs to at least one of the sets."
Sports Example
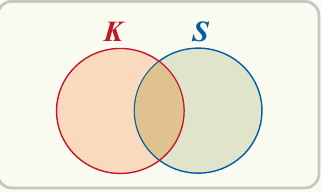
If represents students who play hockey and represents students who play tennis, then includes all students who play either hockey or tennis or both sports.
Remember: Union means "or" in probability!
Intersection
The intersection operation finds what two sets have in common.
The intersection of sets and , written as , contains only the elements that appear in both sets. This represents "what and share."
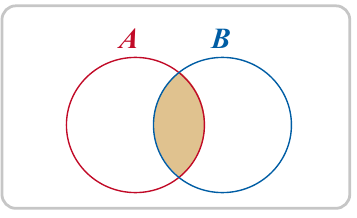
Using our sports example, would be the set of students who play both hockey and tennis.
Remember: Intersection means "and" in probability!
Complement
The complement of a set represents everything that's not in that set.
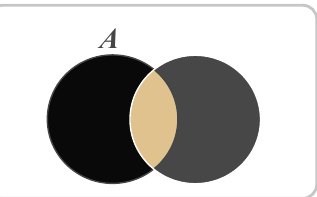
The complement of , written as , includes all elements in the universal set that are not in . We shade the area outside circle to show this.
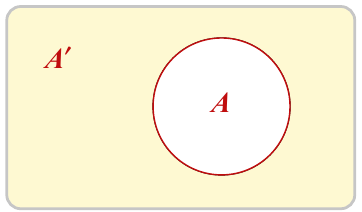
In our example, if is the set of students who play hockey, then is the set of students who do not play hockey.
Remember: Complement means "not" in probability!
Disjoint or mutually exclusive sets
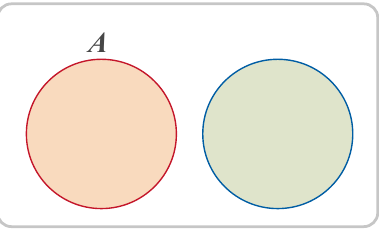
Two sets are disjoint or mutually exclusive if they have absolutely nothing in common. Mathematically, this means (their intersection is the empty set).
Mutually Exclusive Events
Disjoint sets represent events that cannot occur together. For instance, if is the set of girls who play hockey and is the set of boys who play hockey, these sets cannot overlap because no student can be both a girl and a boy.
When events are mutually exclusive, their Venn diagram circles don't touch at all!
Counting elements
We use the notation n(A) to represent the number of elements in set . For example, if , then .
Using Venn diagrams to solve problems
Venn diagrams are powerful tools for organizing information and solving practical problems. The key strategy is to start with the intersection (the overlap) and work outward to the individual regions. Let's work through a complete example.
Worked Example: Students' Weekend Activities
Fifty students were surveyed about their weekend activities. A total of students went to football matches, movies, or both. Of the students who attended football matches, also went to the movies. We can represent this information on a Venn diagram and answer questions about the data.
Question a: How many students went to the movies but not to football matches?
Question b: How many students went neither to football matches nor to the movies?
Solution:
Let represent the set of students who attended football matches.
Let represent the set of students who attended movies.
From the problem, we know:
- (total who went to at least one activity)
- (went to football)
- (went to both)
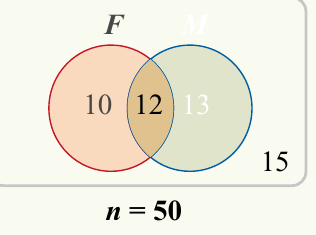
Step 1: Fill in the intersection first.
students went to both activities, so we place in the overlap region.
Step 2: Find the "football only" region.
Since students went to football and of those also went to movies:
Football only = students
Step 3: Find the "movies only" region.
We know total attended at least one activity. We've already placed (football only) and (both):
Movies only = students
Step 4: Find the region outside both circles.
Total students = , and attended at least one activity:
Neither activity = students
Answer a: Students who went to movies but not football are in the region , which contains 13 students.
Answer b: Students who attended neither activity are in region , which contains 15 students.
Worked Example: Calculating Probabilities from Venn Diagrams
Using the information from the previous example, we can calculate probabilities. What is the probability that a randomly selected student from this group of :
Question a: Went to the movies but not to football matches?
Question b: Went neither to football matches nor to the movies?
Solution:
To find probabilities, we divide the number of favorable outcomes by the total sample space.
a)
b)
The sample space is the total number of students, which is .
The addition rule
Venn diagrams help us develop an important rule for calculating probabilities of combined events.
Understanding why we need the addition rule
Suppose we have two events and in a sample space , and they overlap (meaning ).
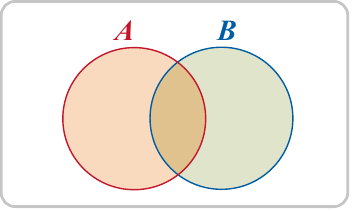
Looking at the Venn diagram, we can see that if we simply add and , we count the intersection twice - once as part of and once as part of . To correct this, we must subtract the intersection once.
This gives us:
If we divide every term by , we get:
When each outcome in is equally likely, each fraction represents a probability. This leads us to the addition rule for probability.
The addition rule for probability
The Addition Rule
The probability of or or both occurring can be calculated using:
This rule applies even when outcomes are not equally likely - it's a fundamental principle that always holds true.
Why subtract the intersection? When we add and , we count any overlap twice. Subtracting ensures we count the intersection exactly once.
Worked Example: Card Probability
A card is chosen at random from a well-shuffled standard deck. What is the probability that the card is a king or a spade?
Solution:
Let be the event "drawing a king."
The set , so .
Let be the event "drawing a spade."
The set , so .
The event "a king or a spade" corresponds to the union .
Step 1: Calculate the individual probabilities.
Step 2: Find the intersection.
(Only the king of spades is in both sets)
Step 3: Apply the addition rule.
(to decimal places)
Notice that without subtracting the intersection, we would have counted the king of spades twice!
Key Points to Remember:
- Set operations have probability interpretations: Union means "or", intersection means "and", and complement means "not"
- Venn diagrams are essential tools for organizing information and visualizing relationships between events
- The addition rule handles overlapping events:
- Always subtract the intersection when using the addition rule to avoid counting outcomes twice
- Disjoint events have no overlap: If , then
- When solving Venn diagram problems: Start with the intersection and work outward