Estimating Probabilities (VCE SSCE Mathematical Methods): Revision Notes
Estimating Probabilities
When working with random experiments that don't have equally likely outcomes, we need different methods to estimate probabilities. This note covers three main approaches: subjective estimates, data-based estimates, and area-based calculations.
Subjective probabilities
Sometimes probabilities are assigned based purely on personal experience or judgment. These are called subjective probabilities.
For example, a sports journalist might suggest Australia has a 60% chance of winning the next Ashes series based on their own assessment. Another journalist could assign a completely different probability to the same event. Because subjective probabilities rely on individual judgment, they can vary widely between people and their accuracy is often debatable.
Key point: Subjective probabilities are personal estimates that may not be reliable or verifiable.
Probabilities from data
A more reliable approach to estimating unknown probabilities is through experimentation. This involves:
- Performing the random experiment many times
- Recording the results
- Using this data to estimate future probabilities
Relative frequency
The proportion of trials resulting in a particular event is called the relative frequency of that event. For most purposes, proportion and relative frequency can be used interchangeably.
Drawing pin example
Consider estimating the probability that a drawing pin lands 'point up' when tossed. Since a drawing pin isn't symmetrical, we cannot assume equally likely outcomes.
Our strategy is to:
- Toss the drawing pin many times
- Count how many times it lands point up
- Calculate the relative frequency
This relative frequency provides an estimate of the true probability.
The convergence principle
The graph below shows results from an experiment where a drawing pin was tossed 150 times, with the probability estimated every 10 throws.
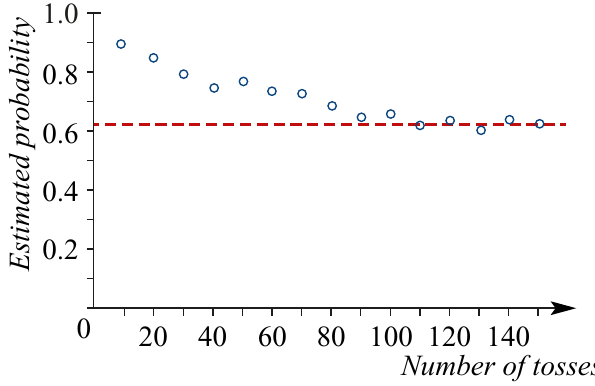
As you can see from the graph, as the number of trials increases, the estimated probability converges toward a stable value (approximately 0.63 in this case).
The Convergence Principle: With more trials, relative frequency becomes a better estimate of true probability.
Key relationship
When the number of trials is sufficiently large, the observed relative frequency becomes close to the actual probability:
for a large number of trials
Understanding variation
It's important to recognise that if you repeat an experiment, the results will generally differ slightly each time. This variation is natural and doesn't mean relative frequency is unreliable.
Rather, it teaches us that:
- Probability estimates are not exact
- Results will vary from sample to sample
- The best estimates come from using as many trials as possible
Exam tip: Always use the largest available sample size when estimating probabilities from data. If multiple data sets are available, combine them to maximise the number of trials.
Worked Example: Estimating Probability from Data
In order to investigate the probability that a drawing pin lands point up, Katia decides to toss it 50 times and counts 33 favourable outcomes. Mikki repeats the experiment, tossing the same drawing pin 100 times and counting 62 favourable outcomes.
a What is Katia's estimate of the probability of the drawing pin landing point up?
From Katia's information:
b What is Mikki's estimate?
From Mikki's information:
c Which of these is the preferred estimate of the probability from these experiments?
Since Mikki has estimated the probability from a larger number of trials (100 vs 50), her estimate would be preferred to Katia's.
d Based on the information available, what would be the preferred estimate of the probability?
The best estimate comes from combining both data sets to maximise the number of trials.
Total favourable outcomes:
Total trials:
Best estimate:
Important interpretation
Probability can be thought of as the proportion of times an event will occur in the long run. This interpretation:
- Confirms that probability values range from 0 (event never occurs) to 1 (event always occurs)
- Shows that probabilities of all possible outcomes sum to 1
Simulation
Simulation means to imitate or model a random experiment so that simulated outcomes closely match real-world outcomes.
Rather than repeating the actual experiment many times, simulation allows us to:
- Model the experiment in a simpler way
- Carry out many trials quickly and easily
- Estimate complex probabilities
Simulation doesn't involve the actual experiment itself. Instead, it uses an approximation that's faster and more practical to repeat multiple times.
Probabilities from area
We can extend the idea of equally likely outcomes to calculate probabilities when areas are involved. The key assumption is that all points in a region have equal probability.
Principle: When a point is equally likely to land anywhere in a region, the probability of landing in a specific area is:
Worked Example: Dartboard Probability
Suppose that a square dartboard consists of a red square drawn inside a larger white square of side length 12 cm, as shown. The red square has sides of 8 cm (leaving 2 cm white border on each side).
If a dart thrown at the board has equal chance of landing anywhere on the board, what is the probability it lands in the red area? (Ignore the possibility that it might land on the line or miss the board altogether.)
Solution:
Area of dartboard = cm²
Area of red square = cm²
Explanation: There are only two possible outcomes - landing in the red area or landing in the white area. We assume that the probability of landing in an area is proportional to the size of that area.
Key Points to Remember:
- Subjective probabilities are based on personal judgment and can vary between people
- Relative frequency = (number of times event occurs) ÷ (number of trials)
- As the number of trials increases, relative frequency converges toward the true probability
- Larger sample sizes give better probability estimates; combine data sets when possible
- Simulation models experiments without actual repetition, making estimation faster
- For geometric probability, use the ratio of areas when all points are equally likely
- Probability estimates from data will vary between samples - this is natural and expected