Probability Tables (VCE SSCE Mathematical Methods): Revision Notes
Probability Tables
What is a probability table?
A probability table provides a tabular method for representing probability problems. It serves as an alternative approach to using Venn diagrams when working with probability calculations. Probability tables are particularly useful when you need to organise information about two events and their complements systematically.
These tables are sometimes called Karnaugh maps in some mathematical contexts, particularly in logic and computer science applications.
Converting from Venn diagrams to probability tables
When two sets and intersect, they create four distinct, non-overlapping regions that partition the sample space. Understanding how these regions relate to probability tables is essential.
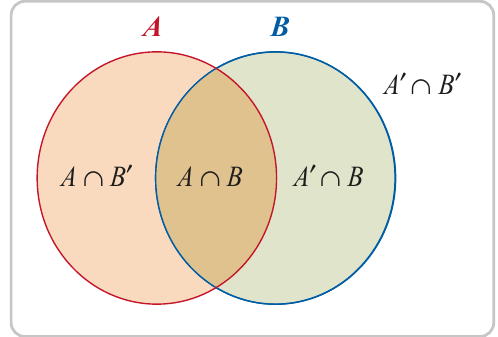
The Venn diagram above shows two intersecting sets and . The diagram reveals four separate regions:
- (the intersection of and )
- (elements in but not in )
- (elements in but not in )
- (elements in neither nor )
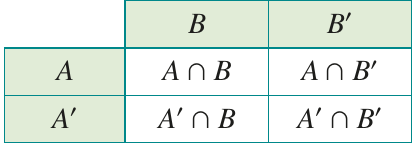
These four regions can be represented in a table format:
Structure of a probability table
In a probability table, each cell contains the probability of the corresponding event occurring. The basic structure uses events and their complements as labels:
Understanding the table structure:
- Rows are labelled with event and its complement
- Columns are labelled with event and its complement
- Cells contain the joint probabilities of the intersections
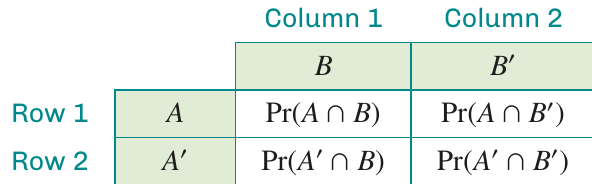
Understanding joint and marginal probabilities
The probabilities in a probability table can be categorised into two types:
Joint probabilities appear in the main cells of the table. These represent the probability of two events occurring together, such as .
Marginal probabilities appear in the row and column totals. These represent the probability of a single event, such as or .
Critical distinction to remember:
Joint probabilities (in the cells) show where two conditions are met simultaneously, while marginal probabilities (in the totals) show the overall probability of a single event regardless of the other event.
Key relationships
Understanding how probabilities relate within the table is crucial. Set can be thought of as the union of two parts: the part that intersects with and the part that doesn't intersect with . Mathematically:
Since and are mutually exclusive (they cannot occur simultaneously), their probabilities add:
This means summing the probabilities in Row 1 gives .
Similarly, the following relationships hold:
For Row 2:
For Column 1:
For Column 2:
Additionally, since complementary events must account for all possibilities:
Therefore, both the row totals and column totals sum to 1.
Complete probability table structure
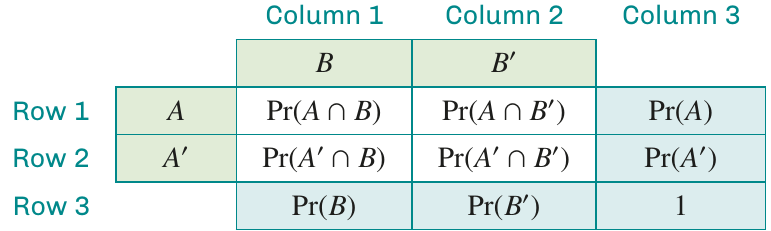
This complete table shows:
- Joint probabilities in the main 2×2 grid
- Marginal probabilities in Row 3 and Column 3
- The total probability of 1 in the bottom right corner
Working with probability tables
Probability tables are powerful tools for solving probability problems. They help you organise given information and systematically find unknown probabilities using the relationships between rows, columns, and totals.
Worked Example: Finding probabilities from given information
If and are events such that , , and , find:
a)
b)
c)
d)
Solution:
First, enter the given information into the table:
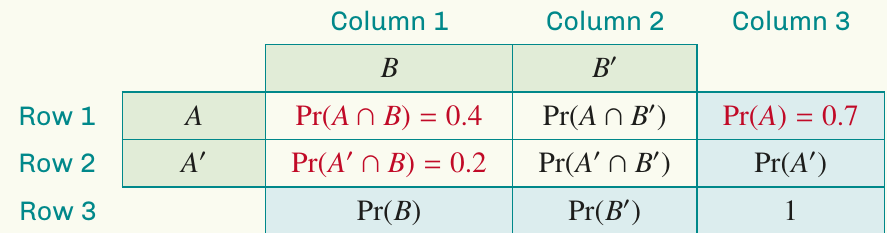
The values shown in red are the given information.
a) To find , use Row 1:
b) To find , use Column 1:
c) To find , first find using Column 3:
Then use Row 2:
d) To find , use the addition rule:
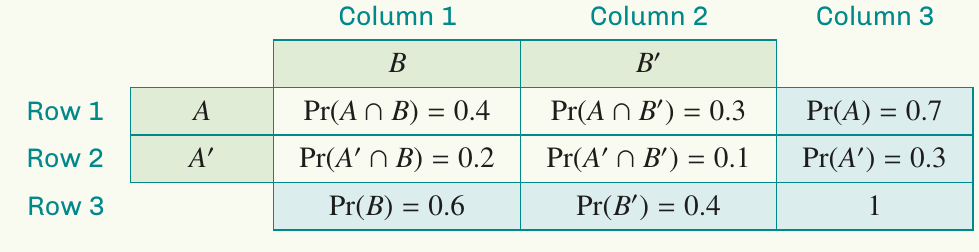
The completed table shows all probabilities:
Worked Example: Real-world application with Australian students
Records indicate that in Australia, 65% of secondary students participate in sport, and 71% of secondary students are Australian by birth. The records also show that 53% of students are both Australian by birth and participate in sport. Use this information to find:
a) The probability that a randomly selected student is not Australian by birth
b) The probability that a randomly selected student is not Australian by birth and does not participate in sport
Solution:
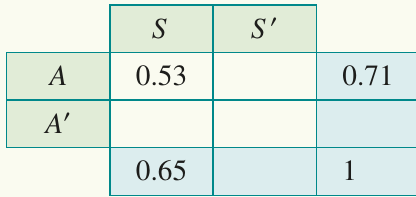
Let represent "Australian by birth" and represent "participates in sport".
From the given information:
- (65% participate in sport)
- (71% are Australian by birth)
- (53% are both)
Enter this information into a table:
Now fill in the remaining cells using subtraction:
For Column 1:
For Column 3:
For Row 1:
For Row 3:
For Row 2:
The completed table is:
| 0.53 | 0.18 | 0.71 | |
| 0.12 | 0.17 | 0.29 | |
| 0.65 | 0.35 | 1 |
a) The probability that a randomly selected student is not Australian by birth is:
b) The probability that a randomly selected student is not Australian by birth and does not participate in sport is:
Key Points to Remember:
- Probability tables provide an organised way to represent probability problems involving two events, serving as an alternative to Venn diagrams.
- The table has four main cells representing the joint probabilities: , , , and .
- Row totals give marginal probabilities for the row events ( and ), while column totals give marginal probabilities for the column events ( and ).
- All probabilities in the table must sum to 1, reflecting that the four regions partition the entire sample space.
- Use row and column relationships to find unknown probabilities by addition or subtraction, making probability tables efficient tools for solving complex problems.