Economic Performance (AQA A-Level Economics): Revision Notes
Inflation and Deflation: The Fundamentals
Understanding inflation and deflation
Inflation occurs when the general level of prices in an economy rises persistently over time. Put another way, it represents a continuous decline in the purchasing power of money. When inflation is present, each pound buys fewer goods and services than it did previously.
Deflation represents the opposite scenario. It describes a sustained decrease in the overall price level, or equivalently, a persistent increase in the value of money. During deflationary periods, the purchasing power of money increases over time.
Both phenomena have significant implications for economic performance, affecting consumers, businesses, and government policy decisions. Understanding the distinction between these concepts is fundamental to analysing macroeconomic policy.
Recent UK inflation experience
The high inflation era (1970s-1980s)
During the 1970s, the UK experienced severe inflationary pressures. Inflation rates were highly variable and accelerating, creating acute economic problems. This crisis elevated inflation control to a top priority for government macroeconomic policy. By 1980, inflation had reached approximately 20%, though it subsequently declined. A brief resurgence occurred in 1990 when inflation touched 10%.
The Great Moderation (1993-2007)
From 1993 to 2007, UK inflation remained remarkably stable. The inflation rate stayed within approximately 1% either side of the government's 2% target, apart from one brief occasion when it exceeded the 3% upper limit. This period coincided with the longest sustained period of economic growth in modern UK history.
The Great Moderation
Control of inflation appeared successful and was accompanied by steady growth. Many other developed economies, including the United States, experienced similar conditions during this period, which became known as 'The Great Moderation'. This era of stability was characterized by low inflation, steady growth, and reduced economic volatility.
In 1997, the government granted operational independence to the Bank of England, allowing it to set interest rates to maintain inflation within the target range. The Monetary Policy Committee (MPC) met monthly (now eight times yearly) to vote on interest rate changes. This independence was viewed as a significant factor in maintaining low inflation.
The 2008 financial crisis and aftermath
The period of stability ended abruptly in 2007. The UK economy was hit by sudden cost-push inflation, largely imported through escalating oil, gas, commodity and food prices. Combined with the credit crunch that began in the USA, this severely undermined business and consumer confidence. The 2008 financial crisis caused aggregate demand to collapse, plunging the UK into its deepest recession since the Second World War.
As the recession deepened, inflation rates began falling. Some economists feared deflation might replace inflation. However, the price level decline that occurred over several months did not constitute true 'deflation' in the technical sense of a persistent fall in prices.
The sharp but temporary falls in oil, gas and commodity prices were primarily responsible for inflation dipping below zero. Most commentators expected positive inflation to return fairly soon.
Recent inflation trends (2012-2022)
From 2012 onwards, inflation remained close to the 2% target with a margin of approximately 1% either side (ranging from 1% to 3%). A brief rise occurred in late 2017, linked to the sharp depreciation of the exchange rate following the 2016 Brexit referendum.
However, inflation began rising significantly in 2021. During 2022, it reached levels close to 10% - rates not experienced for over 30 years. This high inflation was connected to sharp increases in domestic heating bills, petrol and food prices. Most goods and services experienced unexpectedly large price increases during this period.
Oil prices, which remained elevated in 2022, created knock-on effects beyond petrol costs for motorists. They also increased the cost of transporting raw materials and finished products throughout the country. Supply chain disruptions caused by the Covid-19 pandemic, the war in Ukraine, and possibly Brexit-related issues were all considered contributing factors.
By 2022, discussions emerged about 'stagflation' - an unwelcome combination of high inflation and stagnant (flat or falling) economic growth. Forecasters believed there was a rising probability of negative economic growth in 2023.
Disinflation versus deflation
These terms are sometimes confused, so careful distinction is important.
Key Distinction: Disinflation vs Deflation
Disinflation refers to a deliberate policy approach. A deflationary policy employs fiscal and/or monetary measures to reduce aggregate demand, removing excess demand from the economic system. When this occurs, the inflation rate typically falls but remains positive. This is known as disinflation.
Deflation, by contrast, describes an actual fall in the price level. Since the 2008-09 recession, the overall price level has seldom fallen in western industrialised countries.
The term is applied somewhat loosely to describe reductions in aggregate demand and associated levels of economic activity, output and employment. The phrase 'to deflate the economy' has been used since the Keynesian revolution to describe deliberate demand reduction.
Reflation represents the opposite approach - an increase in economic activity and output. A reflationary policy stimulates aggregate demand. The term 'inflation' is sometimes used to describe 'reflation gone wrong', where policy stimulates the price level rather than real output and employment.
Types of inflation
There are two fundamental causes of inflation: excessive aggregate demand in the economy, and general increases in production costs. These give rise to demand-pull inflation and cost-push inflation respectively.
Demand-pull inflation
Demand-pull inflation (also called demand inflation) occurs when aggregate demand increases beyond the economy's ability to supply goods and services. The cause of inflation originates from the demand side of the economy.
Consider the aggregate demand equation:
Components of Aggregate Demand
Where:
- = Consumption spending by households
- = Investment spending by firms
- = Government spending
- = Net exports (exports minus imports)
An increase in any component of aggregate demand can trigger demand-pull inflation.
Sources of Demand-Pull Inflation
Demand-pull inflation can arise from increases in:
- Household consumption spending
- Higher current government spending (such as public-sector pay rises)
- Increased investment spending by firms
- Growth in government capital spending
- Expansion of net exports
If the economy initially produces below its normal capacity level (to the left of the LRAS curve), the price level must rise to persuade firms to produce additional output. When production costs increase as firms expand output, they require higher prices to reward the extra production and maintain profit margins. Once the economy reaches the LRAS curve (normal capacity), higher prices may temporarily encourage firms to produce beyond this point, but such increased output cannot be sustained. Eventually, output falls back to normal capacity, though without any fall in prices.
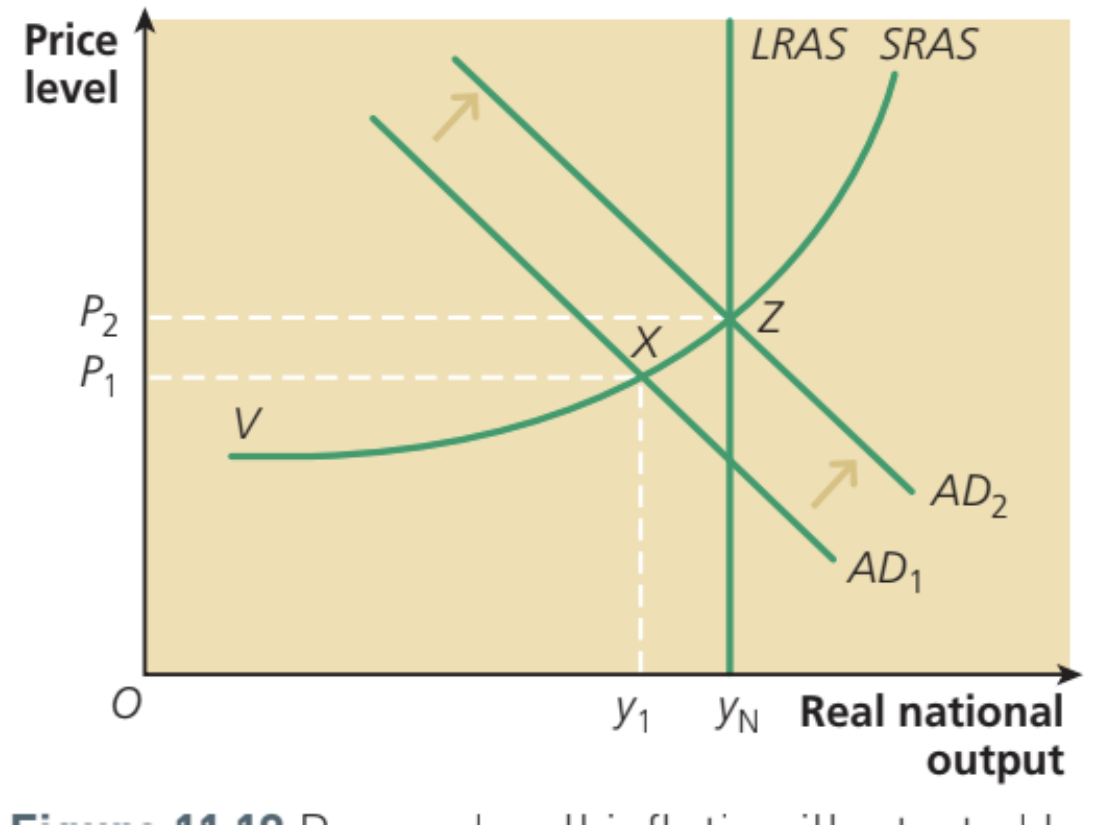
Understanding the Demand-Pull Diagram
Figure 11.19 illustrates demand-pull inflation using an AD/AS diagram. The economy initially produces at equilibrium point X, where output equals and the price level is . When aggregate demand increases (shown by the rightward shift from to ), both output and prices rise. The new equilibrium is at point Z, where output has increased to (normal capacity) and the price level has risen to .
When the economy is already operating at normal capacity (on its LRAS curve), any further rightward shift of aggregate demand results solely in demand-pull inflation in the long run, with no permanent increase in real output.
The diagram also shows why the economy might temporarily produce above normal capacity. At price level , firms are only prepared to produce output . A higher price level creates conditions encouraging firms to increase output from to .
The Recessionary Starting Point
It's important to understand what happens when the AD curve is initially positioned substantially to the left of (for example, at point V). The economy would be in deep recession, experiencing severe demand-deficient or cyclical unemployment.
From this initial position, a rightward shift of aggregate demand would increase output and employment, with relatively modest effects on inflation initially. The adverse effect of rising prices would be less significant than the boost to output and employment from increased aggregate demand. However, as the AD curve shifts rightward and approaches the LRAS curve, the price level effects become increasingly pronounced, whilst output and employment gains give way to inflation.
Cost-push inflation
During the Keynesian era of the 1960s and 1970s, inflation rates increased even when little evidence suggested excess demand in the economy. This observation led to development of cost-push inflation theory.
Cost-push inflation (also called cost inflation) locates the cause of inflation in structural and institutional conditions on the supply side of the economy. This particularly relates to the labour market and wage-bargaining processes (known as wage-cost inflation). Rising prices of energy and/or commodities can also cause cost-push inflation (termed import-cost inflation).
Cost-push theories generally argue that monopoly power growth in the economy's labour market and in markets for goods and services is responsible for inflation. During the Keynesian era, growing trade union strength enabled unions to bargain for money wage increases exceeding any rise in labour productivity. Monopoly firms were prepared to pay these wage increases, partly because of disruption costs, and partly because they believed they could pass on increasing costs as price rises when selling output in their markets.
Weakening of trade union power through legislation means cost-push pressure now more likely arises from increases in raw material prices and other inputs into the production process.
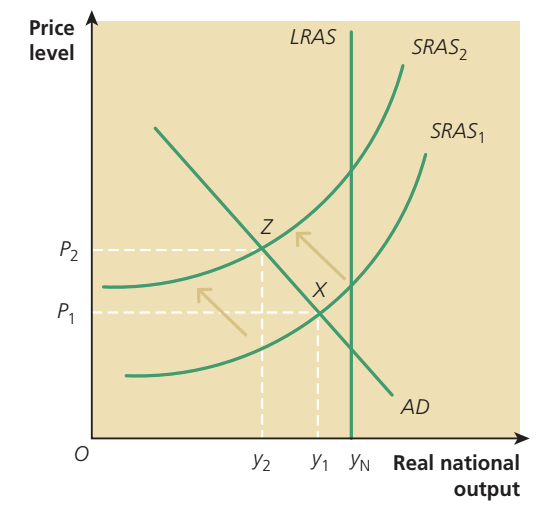
Understanding the Cost-Push Diagram
Figure 11.20 illustrates cost-push inflation on an AD/AS diagram. Equilibrium national income is initially at point X, with real output and price level at and respectively. We assume that money costs of production rise when firms produce more output - for example, because money wages or imported raw material prices increase. This increase in production costs shifts the SRAS curve leftward and upward from to .
As a result of this SRAS curve shift, the price level increases to , whilst higher production costs reduce the equilibrium output level that firms are willing to produce to . The new equilibrium national income is at point Z. The economy could be in recession, in which case recessionary effects may moderate the cost increases.
Why correct diagnosis matters
Just as governments must correctly diagnose the causes of unemployment when implementing policies to reduce it, they must also accurately determine whether inflation results from excess demand or cost-push factors. This diagnosis is crucial for deciding appropriate policies to reduce or control inflation.
The Bank of England's approach
In the early 2000s, the Bank of England, responsible for counter-inflation policy, generally assumed UK inflation was caused by excess aggregate demand. The aggregate demand increases occurring in the 1990s and early 2000s were accompanied by an absence of cost-push inflationary pressure. This was partly due to successful supply-side policies implemented during the 1980s and 1990s, which improved labour market flexibility by reducing trade union power. The UK economy also benefited from globalisation's benign effect, which reduced imported manufactured goods prices at that time.
As long as the assumption held that inflation was caused primarily by excess aggregate demand, raising or lowering interest rates (monetary policy) remained an appropriate policy for controlling inflation. The fact that interest rate policy kept inflation within the government's target range virtually every month between 1997 and 2007 provided further support for the view that UK inflation had been primarily demand-pull in nature.
Recent challenges
More recently, the Bank of England has acknowledged that rising import prices are responsible for cost-push inflation. Indeed, cost-push inflationary pressures have become very significant, particularly those stemming from increased energy, oil and other commodity prices such as copper and wheat. Supply chain disruptions caused by Covid-19, Brexit and the war in Ukraine have added to this pressure.
Policy Limitations with Cost-Push Inflation
In this situation, raising interest rates to reduce aggregate demand can be an ineffective policy for tackling cost-push inflation, unless it is argued the economy should suffer severe recession to reduce demand for imported oil, gas and industrial raw materials.
Consequently, UK governments now face the reality that they may lack the tools for controlling inflation rates, apart from interest rates and other monetary instruments.
Extension: How inflation theories have evolved
Understanding how economic thinking about inflation has developed helps explain current policy debates.
Historical development of inflation theories
| Period | Key Development |
|---|---|
| Eighteenth century to 1930s | The quantity theory of money dominates economic thinking about inflation |
| 1930s | The problem of inflation disappears. Keynes's General Theory explains deflation in terms of deficient aggregate demand |
| 1940s and 1950s | Keynesians develop Keynes's ideas to explain how, in conditions of full employment, excess demand can pull up the price level through demand-pull inflation |
| 1950s | Early monetarist theory of inflation begins developing when Milton Friedman revives the quantity theory of money (the modern quantity theory) |
| 1950s-1960s | Many Keynesians switch from demand-pull to cost-push theory of inflation |
| 1960s | The Phillips curve is introduced into the Keynesian demand-pull versus cost-push debate |
| 1968 | The role of expectations in the inflationary process is incorporated into monetarist theory. The theory of adaptive expectations is built into Milton Friedman's theory of the long-run Phillips curve |
| 1970s | The Phillips curve relationship appears to break down with stagflation's emergence |
| 1980s onwards | Controversy continues between cost-push and demand-pull explanations, with New Keynesian explanations versus monetarist and free-market explanations, the latter incorporating rational expectations into their models |
| 2008 onwards | For a short period the inflation problem largely disappears, being replaced by fear of deflation or falling prices |
| 2015 onwards | Deflation, which had been temporary, gives way to low inflation rates continuing at least until 2019 |
| 2021 onwards | Rapidly rising cost-push inflation in late 2021 and 2022 results from rising energy prices (gas and oil), product shortages and increased costs connected with disruption caused by the Covid-19 pandemic, Brexit and war in Ukraine. High inflation means real incomes fall significantly in 2022, resulting in stagflation where prices rise and economic growth rates fall |
The monetarist perspective
Around 50 years ago, a group of generally pro-free-market economists became known as monetarists. Monetarist economists subscribe to the demand-pull theory of inflation but argue one stage further: they contend that excess aggregate demand for output is caused by a prior increase in the money supply.
Milton Friedman's Famous Statement
The leading monetarist economist Milton Friedman famously stated that 'inflation is always and everywhere a monetary phenomenon'. Monetarist economic theory is known as monetarism. In its narrowest sense, monetarism is the theory that inflation is caused by an increase in the money supply.
In a wider meaning, it is a name given to pro-free-market economic theories and policies.
The quantity theory of money
A very old theory originating hundreds of years ago, the quantity theory of money, lies at the heart of monetarist inflation theory. Suppose government creates or allows an expansion of the money supply greater than the increase in real national output. As a result, this extra money, when spent, pulls up the price level - provided real output does not expand in line with increased spending power. At its simplest, the quantity theory is sometimes described as 'too much money chasing too few goods'.
Physical cash in notes and coins forms a relatively small part of total money supply. The starting point for developing the theory is the equation of exchange, devised by American economist Irving Fisher early in the twentieth century:
Understanding the Equation of Exchange
Where:
- = Money supply (stock of money)
- = Velocity of circulation of money
- = Price level
- = Quantity of output
For a particular time period (say a year), the stock of money in the economy multiplied by the velocity of circulation of money equals the price level multiplied by the quantity of real output in the economy.
The velocity of circulation represents the speed at which money circulates around the economy when people use money to buy goods. Monetarists argue that is constant or at least stable. This means that when increases, it is spent on goods and services. If cannot increase, the price level is pulled up by excess demand.
Keynesian economists, by contrast, believe that when increases, it may be partially absorbed by a slowdown in . This means much of the extra money is not spent on consumer goods and services. (However, some extra money might be spent on investment in new capital goods, which would have a beneficial effect on aggregate demand and economic growth, stimulating rather than .)
In summary, on the right-hand side of the equation can increase either because real output increases or because the price level increases.
The equation of exchange is often written as , where stands for total transactions taking place in the economy. This version was first stated by Irving Fisher. A transaction occurs whenever a good or service is bought and sold. Total transactions include second-hand transactions as well as exchange of new goods and services. Because of this, provides a better measure than of expenditure on national output.
Extension: The Keynesian critique
Keynesian economists generally reject the quantity theory of money as an explanation of inflation, or claim it only provides an explanation of rising prices when several highly restrictive assumptions hold.
Three main Keynesian criticisms
1. The velocity of circulation is not constant
Much debate between Keynesians and monetarists about the quantity theory has centred on whether the velocity of circulation of money is constant. In ordinary language, represents how often money is spent. Monetarists believe that because money earns little or no interest, it is generally rational to spend quickly any extra money holdings, either on goods or on non-money financial assets such as shares, rather than hold idle money balances for any length of time.
By contrast, Keynesians take the opposite view, arguing that under certain circumstances (particularly when share and bond prices are expected to fall), it is perfectly sensible to hold idle money balances. In this situation, to avoid capital losses they expect to suffer from falling financial asset prices, people decide to hold money instead as an idle wealth asset. They hang on to, rather than spend, their extra money holdings.
2. Under-full-employment equilibrium
Keynesians also attack the quantity theory by arguing that if there is spare capacity and unemployment in the economy, an increase in the money supply may increase real income and output and rather than the price level . In the Keynesian view, market forces are too weak and take too long to return the economy to its normal capacity output. This means the economy can become stuck in an under-full-employment equilibrium.
3. Reverse causation
The two Keynesian attacks examined so far accept the monetarist argument that changes in can cause changes in , but they argue that an increase in the money supply does not necessarily result in inflation (an increase in ). Instead, an increase in the money supply may be absorbed in a slowing down of the velocity of circulation of money , or in a reflation of real income or output.
The Reverse Causation Argument
The third Keynesian attack is more fundamental, based on the idea of reverse causation. Instead of changes in the money supply causing changes in the price level, the true relationship is the opposite: changes in the price level cause the money supply to change.
In this interpretation, inflation is caused by cost-push institutional factors in the real economy. The money supply then passively adapts, expanding to the level required to finance the level of desired transactions that the general public undertakes at the new higher price level. In essence, the money supply accommodates itself to (rather than determines) the price level.
Keynesians agree with monetarists over what they consider the rather trivial point that an increase in the money supply is needed to finance a higher price level and allow inflation to continue. However, the reverse causation argument rejects the view that an increase in the money supply is the cause of inflation.
The monetarist response is that if the central bank were to exert control over the money supply, a temporary rise in the price level caused by rising costs could not persist. Keynesians argue that if a government tightly restricts money growth to try to stem inflation, the main effect might be that the current level of transactions cannot be financed, so real activity will fall, resulting in higher unemployment. This effect occurred in the credit crunch that started in 2007, though the cause lay not in tight control of the money supply by government, but in a sudden collapse in the supply of money or liquidity emanating from the banking system itself.
Key Points to Remember:
-
Inflation is a persistent rise in the general price level, whilst deflation is a persistent fall in prices. Don't confuse deflation with disinflation, which refers to a policy to reduce aggregate demand.
-
Demand-pull inflation occurs when aggregate demand exceeds the economy's ability to supply goods and services. It's caused by increases in any component of AD (consumption, investment, government spending, or net exports).
-
Cost-push inflation originates from the supply side through rising production costs, such as higher wages, energy prices, or imported raw material costs. It shifts the SRAS curve leftward.
-
Correctly diagnosing whether inflation is demand-pull or cost-push is crucial for choosing appropriate policy responses. Monetary policy (interest rates) works well for demand-pull inflation but is less effective against cost-push inflation.
-
Recent UK experience (2021-2022) demonstrates how cost-push factors from global energy prices, supply chain disruptions, and geopolitical events can create significant inflationary pressures that are difficult for central banks to control through traditional monetary policy alone.
-
The monetarist view holds that inflation is 'always and everywhere a monetary phenomenon', rooted in the quantity theory of money .
-
Keynesian economists challenge this view, arguing that the velocity of circulation is not constant, that spare capacity allows money supply increases to boost output rather than prices, and that causation may run from prices to money supply rather than the reverse.