Conflicts Between Macroeconomic Policy Objectives (AQA A-Level Economics): Revision Notes
Conflicts Between Macroeconomic Policy Objectives
Introduction to policy conflicts
When governments set economic goals, they often discover that achieving one objective can make it harder to achieve another. This creates what economists call policy conflicts or policy trade-offs. Understanding these conflicts is crucial because governments must make difficult choices about which objectives to prioritise.
UK macroeconomic policy has historically faced four significant short-run conflicts:
- Balancing full employment and economic growth against maintaining a healthy balance of payments
- Achieving low unemployment whilst also controlling inflation
- Promoting economic growth whilst also ensuring fairer income and wealth distribution
- Raising living standards now versus saving for higher living standards in the future
The first conflict relates to external objectives (international trade), whilst the others involve internal domestic goals. These conflicts are particularly important in the short run, though some can persist over longer periods.
The ability to balance multiple macroeconomic objectives simultaneously represents one of the greatest challenges facing modern governments. While all objectives are desirable, the interconnected nature of the economy means that pursuing one goal often creates obstacles to achieving others.
Understanding trade-offs between objectives
Because macroeconomic objectives can be mutually exclusive (achieving one prevents achieving another), governments cannot accomplish everything simultaneously, at least not in the short term. This forces policymakers to make compromises.
For example, a government might accept relatively low unemployment alongside relatively low inflation, recognising that achieving both full employment and complete price stability together is impossible. This represents a trade-off where the government chooses an acceptable balance between two competing goals.
Governments may also change their priorities over time. For instance, a government might focus on reducing unemployment in the months before an election to win votes, knowing that if elected, they may need to switch focus to controlling inflation afterwards.
Real-World Example: UK Coalition Government (2010-2015)
The UK's 2010-2015 coalition government provides a clear illustration of shifting policy priorities:
- Initial Phase: Implemented severe austerity policies that dampened growth and slowed job creation
- Pre-Election Period: As the 2015 election approached, policies were relaxed with more expansionary measures
- Post-Election: Many analysts expected austerity to return after the election, which it largely did
This demonstrates how governments may temporarily shift their policy focus to achieve short-term political objectives, even when it conflicts with longer-term economic goals.
Recent policy dilemmas
In 2022, the UK government and Bank of England faced a particularly challenging situation. With rising inflation and falling economic growth, what should happen to interest rates?
Higher interest rates would likely reduce economic growth further and possibly push the UK into recession. However, leaving interest rates at their 2021 level (or only increasing them slightly) risked the cost-push inflation of 2022 becoming a more serious long-term problem if inflationary expectations became entrenched, potentially creating a wage-price inflationary spiral. A former Bank of England governor described this as the Bank facing a 'narrow path' to avoid recession.
This 2022 dilemma perfectly illustrates the severity of policy conflicts. The Bank of England had to choose between two undesirable outcomes: either risk deeper recession through higher interest rates, or risk entrenched inflation through inaction. There was no 'good' option available—only a choice between different types of economic pain.
How negative and positive output gaps relate to unemployment and inflationary pressures
Understanding output gaps is essential for grasping policy conflicts. An output gap measures the difference between an economy's actual output and its potential (trend) output.
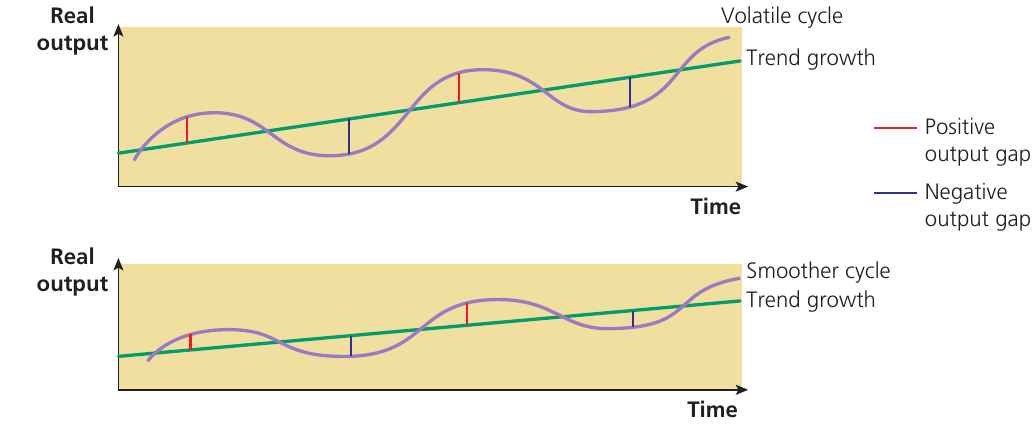
The diagram above shows two scenarios:
- The upper panel displays a volatile economic cycle, where actual output swings dramatically above and below the trend growth line
- The lower panel shows a smoother, more stable economic cycle with smaller fluctuations
A positive output gap occurs when actual output exceeds trend output (shown by red bars). This typically happens during economic booms and is associated with:
- Low unemployment
- Rising inflationary pressures
- Economy operating above its sustainable capacity
A negative output gap occurs when actual output falls below trend output (shown by blue bars). This typically happens during recessions and is associated with:
- High unemployment
- Low inflationary pressures
- Unused capacity in the economy
When inflation rises and unemployment falls during a growing positive output gap, and the opposite occurs with a growing negative output gap, the policy conflict between achieving low unemployment and controlling inflation becomes most severe. The starker the difference between the size of positive and negative output gaps, the greater the policy conflict.
Policy conflicts and the Phillips curve
The short-run Phillips curve
The debate about whether inflation is primarily caused by demand-pull or cost-push factors is sometimes examined using a statistical relationship called the Phillips curve.
Key term: The Phillips curve is based on evidence from the economy showing the apparent relationship between the rate of inflation and the rate of unemployment, now known as the 'short-run Phillips curve'.
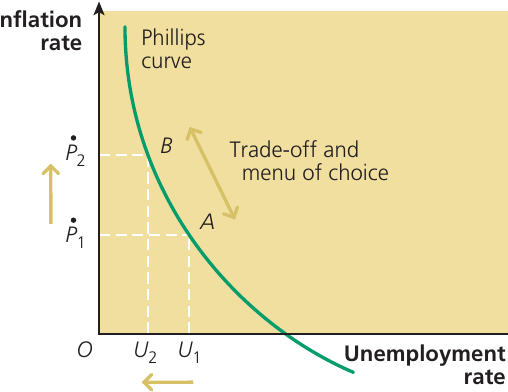
The Phillips curve is named after the Keynesian economist A.W. Phillips, who in the mid-20th century observed that statistical evidence showed an inverse relationship between the rate of wage inflation and the percentage of the labour force unemployed over nearly a century. Later versions of the Phillips curve measure the inverse relationship between unemployment and the rate of price inflation.
Whilst the Phillips curve represents a statistical relationship between two variables rather than a theory of inflation itself, both demand-pull and cost-push theories can explain this relationship:
Demand-pull explanation: The factor causing unemployment to fall and movement up the Phillips curve is excess demand. This pulls up money wages and the average price level.
Cost-push explanation: Falling unemployment means trade union power increases, enabling unions to use their growing monopoly power over the labour supply to push for higher wages.
Critical Understanding: The Phillips curve is a statistical relationship, not a theory of causation. It shows correlation between unemployment and inflation, but economists debate which factors actually cause these movements. Understanding this distinction is essential—the curve describes what happens, not necessarily why it happens.
The Phillips curve as a policy menu
The statistical evidence shown in the Phillips curve illustrates the conflict between full employment and controlling inflation as policy objectives. It also suggests how this conflict might be addressed.
Suppose unemployment initially sits at with an inflation rate of , placing the economy at point A on the Phillips curve. By increasing aggregate demand, the government can move the economy to point B. The unemployment rate falls to , but this comes at the cost of a higher inflation rate at .
Worked Example: Using the Phillips Curve as a Policy Tool
Initial Position:
- Economy at point A
- Unemployment rate:
- Inflation rate:
Policy Action: Government increases aggregate demand through expansionary fiscal or monetary policy
New Position:
- Economy moves to point B
- Unemployment rate: (lower than )
- Inflation rate: (higher than )
Trade-off: The government has successfully reduced unemployment, but at the cost of accepting higher inflation.
Using demand management policies, it appears possible for governments to trade off between increasing employment in the economy and reducing inflation. Points such as A and B on the Phillips curve represent a menu of choice for governments when deciding an acceptable combination of unemployment and inflation.
The long-run Phillips curve
Modern economists generally recognise that the Phillips curve shown previously represents a short-run Phillips curve (SRPC), depicting the short-run relationship between inflation and unemployment.
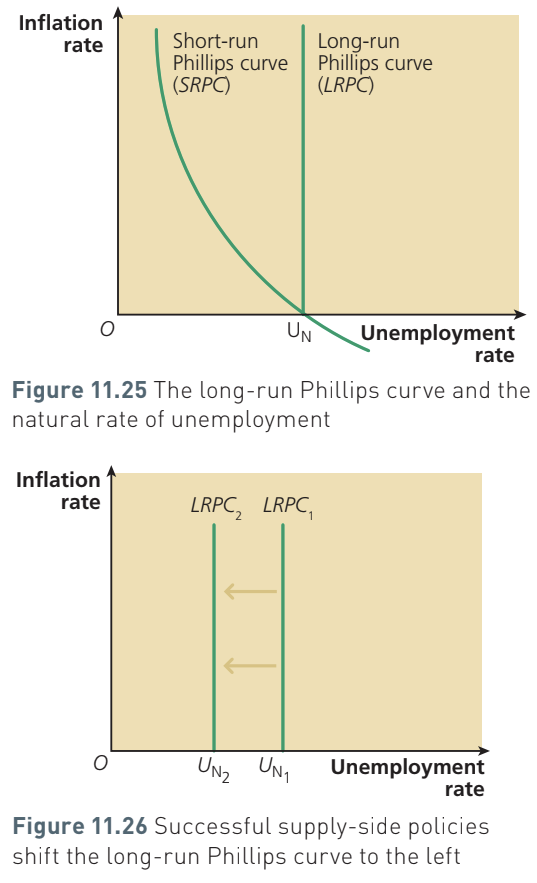
A vertical long-run Phillips curve (LRPC) has been added to the analysis, intersecting the short-run Phillips curve where the inflation rate is zero. The unemployment rate at this point is the natural rate of unemployment (NRU), shown by the symbol . (When expressed as the unemployment level rather than rate, it's called the natural level of unemployment.)
Free-market economists argue that reducing unemployment below the natural level is impossible, except at the cost of suffering an ever-accelerating and unanticipated inflation rate. This would likely accelerate into hyperinflation, causing severe damage to the economy.
Why Expectations Matter
The original Keynesian explanation of the short-run Phillips curve wrongly considered only the current rate of inflation whilst ignoring the important influence of the expected rate of inflation.
When government increases aggregate demand to reduce unemployment below the natural level:
- People revise upwards their expectations of future inflation
- This leads to higher current inflation
- Continuous upward revision of expected inflation leads to higher and higher rates of current inflation
This demonstrates why understanding inflationary expectations is crucial for effective policy-making.
The role of supply-side policies
According to free-market economists, the immediate solution is for government to respond to its mistake of trying to keep unemployment below its natural level by reducing aggregate demand to take unemployment back to its natural level.
However, the long-term solution is to reduce the natural level itself. This can be achieved by implementing appropriate supply-side policies (discussed in Chapter 13), which shift the long-run Phillips curve to the left. When the curve shifts from to , the natural rate of unemployment falls from to .
In essence, supply-side economists argue that provided the 'correct' supply-side policies are implemented, the policy objectives of reducing unemployment and controlling inflation are compatible in the long run, though not necessarily in the short run.
Understanding shifts in short-run Phillips curves
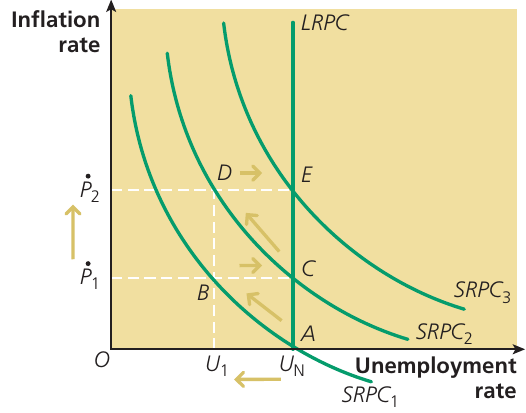
The complete Phillips curve model shows multiple short-run Phillips curves (, , ) alongside the vertical long-run Phillips curve (LRPC). Each short-run curve represents a different expected rate of inflation.
When workers and firms continuously adjust their expectations of future inflation to match the rising actual rate and bargain for ever-higher money wages, the short-run Phillips curve shifts outwards. The curve moves from to and so on. Indeed, there exists a separate short-run Phillips curve for each expected rate of inflation.
'Further-out' short-run Phillips curves such as and are associated with higher expected rates of future inflation. Conversely, the short-run Phillips curve shifts inwards when the expected rate of inflation falls.
Free-market economists contend that in the long run, the only way to keep unemployment below its natural level is to permit the money supply to expand and finance an ever-accelerating rate of inflation. Actual inflation must always exceed the expected rate for workers and firms to be willing respectively to supply and demand more labour.
The Danger of Accelerating Inflation
If government attempts to keep unemployment below the natural level through monetary expansion, accelerating inflation will eventually create hyperinflation. In the resulting breakdown of economic activity, this will likely increase the natural level of unemployment.
Therefore, any attempt to reduce unemployment below its natural level is foolhardy and irresponsible because:
- Short run: It leads to accelerating inflation
- Long run: It perversely increases the natural level of unemployment (and the NRU) to unnecessarily high levels
Stabilising inflation expectations
If government realises it made a mistake when expanding the economy to point B, it can stabilise the inflation rate at 5%. Workers and employers 'see through' their money illusion and realise they have confused money quantities with real quantities. Once this happens, they refuse respectively to supply and demand the labour necessary to keep unemployment below its natural level. The economy moves to point C.
Key lessons from the Phillips curve analysis
Pro-free-market economists generally believe that successful supply-side policies, combined with supply-side reform in the private sector, facilitate the production of high-quality goods and services which people in the UK and abroad wish to buy. They cite the recent success of car manufacturing in the UK as evidence. According to this supply-side view, sustained economic growth in the long run resolves short-run conflicts between policy objectives. The supply-side approach to economic policy is examined thoroughly in Chapter 13.
Alternative Perspectives
Other economists argue that the supply-side view is overstated. They contend that:
- Other countries will attempt the same measures, meaning gains are 'cancelled out'
- Some supply-side policies, such as reducing trade union power, are likely to damage labour productivity as job security worsens
This highlights that there is no universal agreement among economists about the best approach to resolving policy conflicts.
Reconciling possible policy conflicts in the short run and the long run
In the short run, policy conflicts between reducing unemployment and achieving price stability might be reconciled in a highly depressed economy where output is well below its normal capacity, as illustrated on a Keynesian AS curve.
However, if the economy is initially producing on its vertical LRAS curve (or on the vertical section of a Keynesian AS curve) with unemployment at its natural level, short-run reconciliation is no longer possible. Instead, government should try to improve supply-side conditions in the economy in the hope of increasing labour productivity and making the economy more competitive in world markets.
Key Points to Remember:
-
Macroeconomic policy objectives are often mutually exclusive, making it impossible for governments to achieve all objectives simultaneously, particularly in the short run
-
The short-run Phillips curve illustrates a trade-off between unemployment and inflation, but this is a statistical relationship rather than a theory of inflation itself
-
The long-run Phillips curve is vertical at the natural rate of unemployment, suggesting no long-run trade-off exists between inflation and unemployment
-
Supply-side policies can shift the long-run Phillips curve leftwards, reducing the natural rate of unemployment
-
In the short run, policy conflicts can be reconciled if there is significant spare capacity in the economy, but this is not possible when the economy is at full capacity
-
Understanding the distinction between short-run and long-run policy effects is crucial for effective macroeconomic management