Economic Growth and the Economic Cycle (AQA A-Level Economics): Revision Notes
Economic Growth and the Economic Cycle
Introduction
Economic performance is a key measure of how well an economy is functioning. Governments judge their success based on achieving four main macroeconomic objectives: sustainable economic growth, low unemployment, stable prices (controlled inflation), and avoiding external deficits. This note focuses on the first of these objectives and explores how economies fluctuate over time.
These four macroeconomic objectives form the foundation of government economic policy. Achieving all four simultaneously is challenging, as policies to address one objective may conflict with others - a concept known as policy trade-offs.
Understanding economic growth is essential for analysing how living standards improve and how economies develop their productive capacity. We also examine the economic cycle, which describes the regular ups and downs in economic activity that all economies experience.
Short-run and long-run economic growth
Economic growth can occur in two distinct ways, and it's important to understand the difference between them.
What is economic growth?
Economic growth refers to an increase in the potential level of real output that an economy can produce over a period of time. The measurement of economic growth is performed by calculating the percentage annual change in real GDP (or real GDP per capita).
Real GDP measures the total value of all goods and services produced in an economy, adjusted for inflation. Using real GDP (rather than nominal GDP) allows us to make meaningful comparisons over time.
Short-run economic growth
Short-run economic growth occurs when an economy makes better use of its existing resources. This happens when there are idle or underutilised resources in the economy - such as unemployed workers or factories running below capacity.
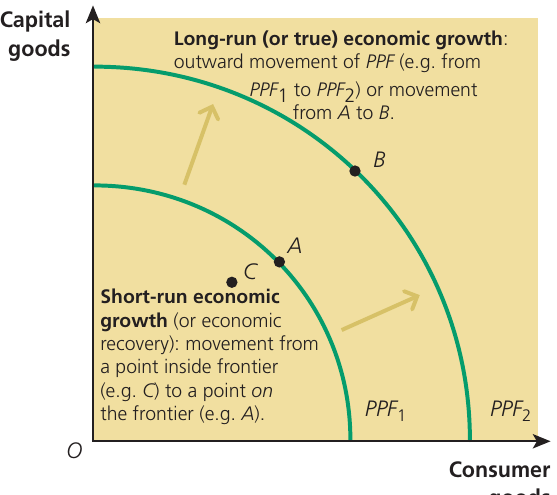
When aggregate demand increases, these spare resources are brought into production. The economy moves from a point inside its production possibility frontier (PPF) to a point on the frontier itself.
Worked Example: Factory Capacity Utilisation
Consider a car factory that has the capacity to produce 1,000 cars per month but is currently only producing 700 cars per month due to weak demand.
- Current situation: Factory operating at 70% capacity
- After demand increase: Factory increases production to 950 cars per month (95% capacity)
- Result: Output has increased by 250 cars per month
This represents short-run growth - the factory hasn't become any larger, but it's using its existing capacity more fully. No new investment was needed; the factory simply brought its idle resources into production.
Short-run growth is particularly important during economic recoveries, when economies are bouncing back from recessions. In these situations, bringing unemployed workers back into jobs and utilising spare capacity generates economic growth without requiring new investment in capital or technology.
Long-run economic growth
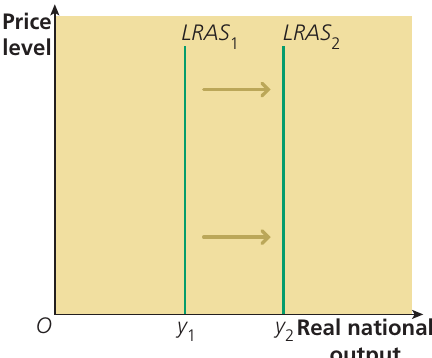
Long-run economic growth is fundamentally different. It occurs when the economy's productive capacity itself increases. This is shown by an outward shift of the entire production possibility frontier.
Long-run growth happens when the economy acquires more resources or uses its existing resources more efficiently. This could be through:
- Investment in new capital equipment (factories, machinery, infrastructure)
- Improvements in technology and innovation
- Growth in the labour force (through population growth or increased participation)
- Better education and training (improvements in human capital)
- Enhanced productivity of workers
- Entrepreneurship and better business organisation
Key Distinction:
- Short-run growth = Using existing capacity more fully (movement TO the PPF)
- Long-run growth = Expanding total capacity (outward SHIFT of the PPF)
Short-run growth is about using what you have more fully, whilst long-run growth is about increasing what you have.
Unlike short-run growth, long-run growth genuinely expands what an economy is capable of producing. It increases the trend level of output that can be sustained without creating inflationary pressure.
Demand-side and supply-side determinants of short-run growth
Short-run economic growth is primarily driven by changes in either aggregate demand or aggregate supply. Let's examine each in turn.
Demand-side determinants
The demand side relates to the impact of changes in aggregate demand on the economy. When we talk about demand-side factors, we're referring to anything that shifts the position of the aggregate demand (AD) curve.
The aggregate demand equation helps us understand what influences demand in the economy:
Where:
- = Consumption (household spending)
- = Investment (business spending on capital)
- = Government spending
- = Net exports (exports minus imports)
Any increase in consumption, investment, government spending, or net export demand causes the AD curve to shift to the right. This leads to demand-induced short-run economic growth.
Factors That Shift AD Components:
Consumption increases when:
- Consumer confidence rises
- Incomes increase
- Interest rates fall
- Wealth increases (e.g., rising house prices)
Investment increases when:
- Business confidence improves
- Interest rates fall
- Expected future profits rise
- Corporation tax decreases
Government spending increases through:
- Fiscal stimulus policies
- Infrastructure projects
- Increased public sector wages
Net exports increase when:
- The exchange rate depreciates
- Foreign incomes grow
- UK goods become more competitive
When the AD curve shifts rightward along an upward-sloping SRAS (short-run aggregate supply) curve, real output increases. Initially, if the economy has substantial spare capacity, output can increase with little or no effect on the price level. However, as the economy approaches full capacity, further increases in aggregate demand lead to rising inflation as well as increased output.
Supply-side determinants
The supply side relates to changes in the potential output of the economy, which is affected by the available factors of production (land, labour, capital, and enterprise) and their productivity.
Supply-side factors affect the position of the aggregate supply curves. In the short run, anything that changes firms' costs of production can shift the SRAS curve:
- Wage rates: A fall in money wage rates reduces production costs and shifts SRAS to the right
- Raw material prices: Lower commodity prices reduce business costs
- Taxes on firms: A reduction in business taxes (like corporation tax) lowers costs
- Subsidies: Increased subsidies to firms effectively reduce their costs
- Exchange rate: A stronger pound reduces the cost of imported raw materials
However, the main impact of supply-side improvements is on the position of the LRAS (long-run aggregate supply) curve, which we'll explore in the next section on long-run growth.
Case study: UK recession statistics revision
The Office for National Statistics (ONS) regularly revises its published economic data. This highlights an important point about economic statistics - initial estimates are based on incomplete information and are subject to revision as more data becomes available.
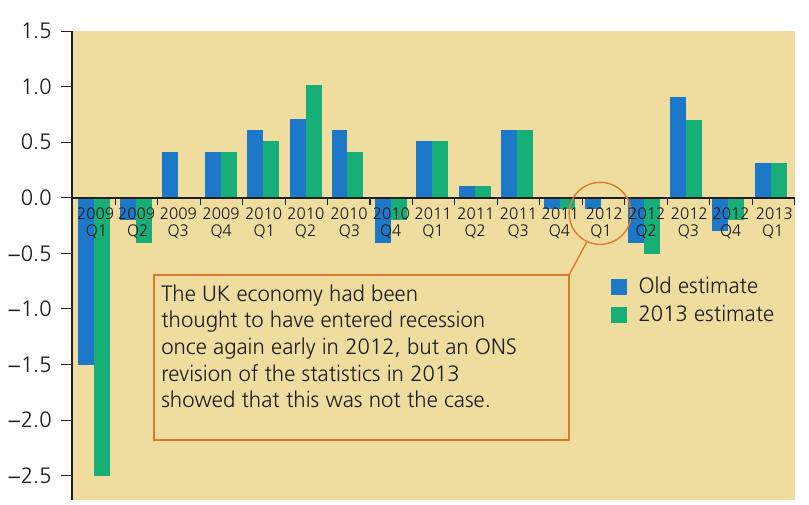
The Double-Dip That Never Was
In 2012, the UK economy was initially thought to have entered a "double-dip" recession - a second recession following the 2008-09 financial crisis. However, when the ONS revised its statistics in 2013, it showed that the second dip had not actually occurred. The economy had experienced slow growth rather than a recession.
This case illustrates the importance of understanding that economic data can change as more accurate information emerges. It also shows why policymakers must be cautious when making decisions based on preliminary data.
Demand-side and supply-side determinants of long-run growth
Long-run economic growth - the expansion of the economy's productive capacity - is determined by different factors than short-run growth.
The trend growth rate
The trend growth rate (also called the potential growth rate or long-run growth rate) is the rate at which output can grow, on a sustained basis, without putting upward or downward pressure on inflation. It reflects the annual average percentage increase in the productive capacity of the economy.
Before the UK entered recession in 2008, the UK's trend growth rate was estimated at about 2.5% per year. This may seem modest, but because of the compound interest effect, a 2.25% growth rate means that average UK living standards double approximately every generation (about 30 years).
Declining UK Trend Growth
There is evidence that the UK's trend growth rate has fallen in recent years, possibly to as low as 1-2%. This decline is concerning because it means the economy's capacity to grow without inflation has diminished.
Several factors may explain this:
- Reduced business investment following the financial crisis
- Lower productivity growth
- An ageing population
- Increased economic inactivity (people of working age not participating in the labour force)
- The economic impact of Brexit and the Covid-19 pandemic
The causes of long-run economic growth
Long-run economic growth is caused by increases in aggregate supply that expand the economy's production possibility frontier. The main determinants include:
Investment and capital accumulation
Investment in new capital goods - machinery, equipment, factories, and infrastructure - increases the economy's productive capacity. When firms invest, they expand their ability to produce goods and services. This includes:
- Physical capital (factories, machinery, equipment)
- Infrastructure (roads, railways, telecommunications, energy networks)
- Research and development facilities
Technological progress
Advances in technology improve productivity by allowing more output to be produced from the same inputs. Technological progress can take many forms:
- New production processes that are more efficient
- Innovation in products and services
- Digital technologies that improve communication and coordination
- Automation that increases labour productivity
Growth in the labour force
A larger workforce expands productive capacity. The size of the labour force can increase through:
- Population growth
- Increased labour force participation (more people of working age choosing to work)
- Immigration of working-age people
- Later retirement ages
Improvements in human capital
Human capital refers to the skills, knowledge, and experience of the workforce. Improvements come through:
- Better education and training
- On-the-job learning and experience
- Health improvements that increase worker productivity
Increased productivity
Productivity measures output per unit of input (typically output per worker or output per hour worked). Higher productivity means the economy can produce more with the same resources. Productivity improvements result from:
- Better technology and equipment
- More skilled and experienced workers
- Better organisation and management
- Improved work practices
Enterprise and innovation
Entrepreneurship drives growth by:
- Creating new businesses and industries
- Developing innovative products and services
- Finding more efficient ways to organise production
- Taking risks to exploit new opportunities
Supply-side policies
Government policies can help create the conditions for long-run growth by:
- Encouraging research and development through tax incentives
- Investing in education and training
- Improving infrastructure
- Reducing barriers to business creation
- Creating a stable legal and institutional framework
The Role of Aggregate Demand in Long-Run Growth
Whilst long-run growth is fundamentally a supply-side phenomenon, aggregate demand still plays an important role. Firms will only invest in expanding their productive capacity if they expect sufficient demand in the economy to absorb the extra output. Strong aggregate demand provides the confidence and incentive for businesses to undertake the investment that drives long-run growth.
The costs and benefits of economic growth
For many economists and policymakers, achieving satisfactory and sustained economic growth is the most important macroeconomic objective. However, economic growth brings both benefits and costs that must be carefully considered.
Benefits of economic growth
Higher living standards
Economic growth increases real incomes and enables people to consume more goods and services. This is the primary benefit - people can afford better housing, food, healthcare, education, and leisure activities. Material living standards rise as the economy expands.
Poverty reduction
Growth provides a route out of poverty for much of the world's population. As economies expand, employment opportunities increase and incomes rise. This is particularly important in developing countries where large populations live in extreme poverty.
Improved public services
Economic growth generates a "fiscal dividend" - increased tax revenues for the government. These additional revenues can be used to:
- Fund better healthcare and education
- Improve infrastructure
- Provide social welfare support
- Correct market failures
- Invest in environmental protection
Importantly, governments can improve public services without raising tax rates when the economy is growing.
Employment creation
Growing economies typically create more jobs, reducing unemployment. This brings benefits beyond just income - employment provides people with purpose, social connections, and self-esteem.
Increased life expectancy and health
Economic growth has historically been associated with:
- Better healthcare and medical advances
- Improved nutrition
- Cleaner water and sanitation
- Safer working conditions
- Reduced disease
Technological and environmental benefits
Growth can fund the development of environmentally friendly technologies that reduce the ratio of energy consumption to GDP. Innovation driven by economic growth may lead to cleaner production methods and renewable energy sources.
Business confidence and investment
Successful countries can experience a virtuous circle where economic growth generates greater business confidence, leading to increased investment in cutting-edge technology, which produces higher profits and even more growth.
Costs of economic growth

Environmental degradation
Economic growth often comes with significant environmental costs:
- Resource depletion: Growth uses up finite resources like oil, minerals, and forests that cannot be replaced
- Pollution: Industrial production and increased consumption lead to air, water, and soil pollution
- Climate change: Higher economic activity increases greenhouse gas emissions, contributing to global warming
- Loss of biodiversity: Economic development destroys habitats and leads to species extinction
Inequality
Growth can widen inequalities in the distribution of income and wealth. Whilst some people benefit greatly from economic expansion, others may be left behind. Increased automation brought about by technological progress may reduce overall demand for labour, affecting lower-skilled workers particularly severely.
Cultural and social costs
Economic growth can:
- Destroy local cultures and communities
- Lead to urbanisation and the abandonment of rural areas
- Swallow up good agricultural land as cities expand
- Disrupt traditional ways of life
Population pressures
In its early phases, economic growth often leads to rapid population growth, creating more mouths to feed and more pressure on resources.
Unsustainability
High rates of growth may not be sustainable in the long run, especially in developing and emerging-market economies. The rapid depletion of resources and environmental degradation may reach a point beyond which the economy cannot recover.
Winners and losers
Growth produces both winners and losers. Countries experiencing low growth may enter a vicious circle of declining business confidence, low profits, low investment, and lack of international competitiveness, leading to even lower profits and potentially zero or negative growth.
The impact on individuals, the economy, and the environment
Economic growth affects different groups in different ways. The wealthy and many middle-income earners benefit from higher incomes and better future prospects. However, the poor may suffer from job losses due to automation and increased inequality.
From an economy-wide perspective, growth can increase international competitiveness, but it may also mean that slower-growing economies miss out on the benefits. For the environment, the costs often outweigh the benefits, leading to concerns about whether current growth patterns are sustainable.
Sustainable versus Sustained Growth
It's important to distinguish between sustained growth and sustainable growth:
-
Sustained growth means achieving a particular rate of economic growth (on average) over a number of years. For example, the UK sustained an average annual growth rate of about 2.75% from 1992 until 2008.
-
Sustainable growth refers to growth that can continue indefinitely without depleting resources or causing irreversible environmental damage. A growth rate that is sustained over many years may nevertheless be unsustainable if it leads to environmental problems, depletion of vital finite resources, and degradation of the natural world.
The challenge for modern economies is to find ways to achieve growth that is both sustained (continuous over time) and sustainable (environmentally and socially responsible).
The economic cycle
Economies don't grow smoothly over time. Instead, they experience fluctuations - periods of faster growth followed by slowdowns or even contractions. These regular fluctuations are known as the economic cycle.
What is the economic cycle?
The economic cycle (also known as the business cycle or trade cycle) refers to the upswing and downswing in aggregate economic activity that takes place over a period of approximately 4 to 12 years.
Economic fluctuations occur in two main ways:
- Seasonal fluctuations: Short-term changes caused by factors like weather (e.g., reduced construction in winter, increased tourism in summer)
- Cyclical fluctuations: Longer-term swings in economic activity lasting several years
It's the cyclical fluctuations that we refer to as the economic cycle. These are caused primarily by changes in aggregate demand, though supply-side factors can also play a role.
Phases of the economic cycle
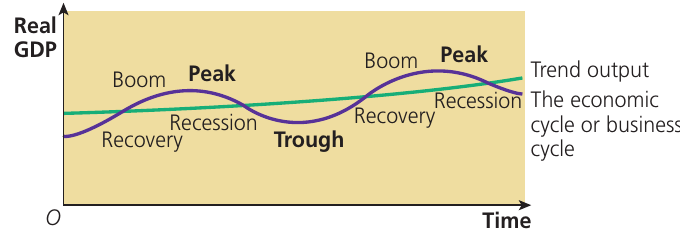
The economic cycle consists of several distinct phases:
1. Recovery
Recovery occurs when real GDP begins to grow after the end of a recession. The economy moves out of the trough (the lowest point) and output starts to increase. During recovery:
- Unemployment begins to fall
- Business confidence slowly improves
- Consumer spending gradually increases
- Investment starts to pick up
2. Boom
The boom phase occurs when the level of real output becomes greater than the trend level of output. During a boom:
- The economy grows rapidly
- Unemployment falls to low levels
- Business confidence is high
- Consumer spending is strong
- Inflationary pressures begin to build
- Investment is high
- A positive output gap emerges (actual output exceeds trend output)
3. Peak
The peak represents the highest point of the cycle, where output reaches its maximum before beginning to decline. The economy operates above its sustainable capacity.
4. Recession
A recession represents a downturn in the economic cycle. In the UK, a recession is officially defined as real national output falling for six months or more (two consecutive quarters of negative GDP growth).
Recession Characteristics
During a recession:
- Real GDP falls
- Unemployment rises
- Business confidence declines
- Consumer spending decreases
- Investment falls
- Inflationary pressures ease
- A negative output gap emerges (actual output falls below trend output)
A severe recession lasting two years or more is sometimes called a depression, though there is no universally accepted definition of a depression.
5. Trough
The trough is the lowest point of the cycle, where output reaches its minimum before recovery begins.
Actual output and the economic cycle
Actual output refers to the level of real output produced in the economy in a particular year. This should not be confused with the trend level of output, which represents what the economy is capable of producing when working at full capacity.
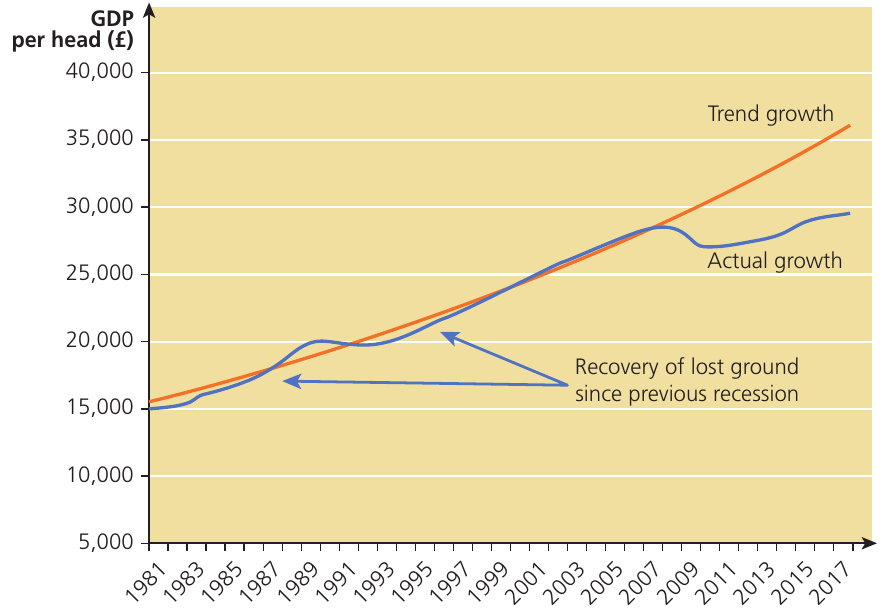
Actual output rises and falls in the different phases of the economic cycle. The diagram above shows how UK GDP per head fluctuated around its trend growth path. Notice how actual growth fell significantly during the 2008-09 recession and remained below the trend line for many years afterwards, representing "lost ground" that was not recovered.
Continuous growth versus cyclical growth
Growth Without Recessions
It's important to understand that an economy can experience continuous positive growth without having a traditional economic cycle with recessions. In such cases:
- The rate of positive growth varies (slowing down in downswings, speeding up in upswings)
- Negative growth (recession) does not occur
- Output continues to increase, just at varying rates
Between 2010 and 2014, for example, UK economic growth was never negative but was generally slow and below increases in the trend level of output. This represents a slowdown rather than a recession.
The causes of change in the phases of the economic cycle
What causes economies to move through these different phases? Economists have identified several key factors.
Fluctuations in aggregate demand
The primary explanation for economic cycles comes from changes in aggregate demand. John Maynard Keynes argued in the 1930s that economic recessions are caused by fluctuations in aggregate demand, which are in turn caused by changes in consumer and business confidence.
How confidence drives the cycle:
- In an upswing: Consumer and business confidence is high → spending and investment increase → aggregate demand rises → output and employment grow → confidence rises further → the cycle reinforces itself
- In a downswing: Confidence falls (due to pessimism) → spending and investment decrease → aggregate demand falls → output and employment decline → confidence falls further → the cycle reinforces itself
This is still the prevailing view today. Confidence, expectations, and sentiment play crucial roles in driving economic fluctuations.
Supply-side factors
Whilst demand-side factors are the primary cause of economic cycles, supply-side factors can also trigger cyclical changes. Edward Prescott and Finn Kydland, Nobel Prize winners in economics, developed a theory of "real business cycles" that argues changes in technology and productivity on the supply side might be as important as changes in aggregate demand in explaining economic fluctuations.
Other factors contributing to cyclical changes
Speculative bubbles
Rapid economic growth can lead to speculative bubbles in asset prices. When people realise that house prices or share prices have risen far above their real values, a correction occurs:
- Asset prices rise rapidly during growth
- People recognise the bubble
- Asset selling replaces asset buying
- Prices collapse
- Consumer and business confidence is destroyed
- Spending falls and the economy enters recession
The resulting instability is worsened by excessive growth in credit and debt levels, leading to "boom and bust" cycles. Terms like "animal spirits" (Keynes) and "herding" describe how financial markets can "overshoot" during periods of irrational exuberance and then "undershoot" when bubbles burst.
Political business cycle theory
In democratic countries, general elections occur every four or five years. As an election approaches, the governing party may attempt to engineer a pre-election boom through expansionary fiscal or monetary policy to win votes. After the election, the government then deflates aggregate demand to prevent overheating. When the next election approaches, demand is expanded again.
Outside shocks
Economic shocks can trigger or exacerbate economic cycles. Shocks divide into:
- Demand shocks: Events that affect aggregate demand (e.g., sudden loss of consumer confidence, financial crises)
- Supply shocks: Events that impact aggregate supply (e.g., oil price spikes, natural disasters, pandemics)
Worked Example: War in the Middle East
Consider how conflict in the Middle East affects the UK economy:
Demand shock effects:
- Business confidence falls as uncertainty increases
- Firms postpone investment projects
- Consumers reduce discretionary spending
- AD shifts leftward
Supply shock effects:
- Oil prices spike sharply
- Production costs increase across all industries
- SRAS shifts leftward
- Firms reduce output
Combined impact:
- Both AD and SRAS contract
- Real GDP falls significantly
- The economy may enter recession
- Inflation may rise (stagflation)
The 2022 war in Ukraine provides a real-world example, causing very large increases in gas prices that added to the cost of living.
Changes in inventories (stocks)
Firms hold stocks of raw materials and finished goods to smooth production and cope with fluctuations in demand. Although inventory investment typically accounts for less than 1% of GDP, swings in inventories are often the single most important determinant of recessions.
When firms over-estimate demand, stocks of unsold finished goods build up. As stocks accumulate, firms cut production by more than the original fall in demand, triggering a recession. This destocking process can turn a slowdown into a recession. In the USA, swings in inventory investment have accounted for about half of the fall in GDP during recent recessions.
Indicators of economic cycle phases
Whilst we primarily measure the economic cycle using changes in real GDP, other economic indicators also help identify which phase of the cycle the economy is in.
Key indicators
Inflation
In the upswing of the cycle, especially during the boom phase, excess aggregate demand begins to pull up the price level. Cost pressures from labour shortages lead to nominal wages and salaries rising faster than real wages. Inflation increases during booms and tends to fall during recessions.
Investment
Business confidence is higher in upswings, leading to increased private-sector investment. During downswings, confidence collapses and investment projects are cancelled or postponed. Investment is strongly pro-cyclical (it moves in the same direction as the overall cycle).
Unemployment and employment
Employment increases (and unemployment decreases) during the recovery and boom phases. During recessions, unemployment rises. However, eventual labour shortages during prolonged booms may lead to higher inflation.
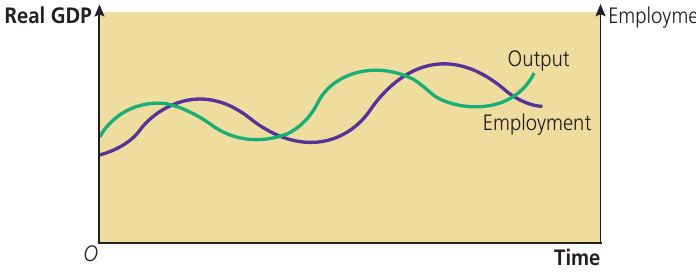
The Employment Lag
The employment cycle tends to lag behind the output or GDP cycle. As the diagram shows, changes in employment typically occur slightly after changes in output. This is because:
- Firms are often reluctant to hire workers immediately when growth picks up (they may use overtime or temporary workers first)
- Firms are reluctant to lay off workers immediately when growth slows (they may initially reduce hours or freeze hiring instead)
This lag between output and employment cycles can create policy challenges. Politicians tend to be more influenced by what is happening to jobs than to GDP. Governments may expand the economy to reduce unemployment even when real GDP has already begun its recovery, potentially leading to excessive inflation. Similarly, governments may try to slow a "frothy" jobs market even though real GDP has already begun to decline.
The economic cycle and output gaps
A key concept for understanding economic cycles is the output gap - the difference between actual output and trend (or potential) output.
Understanding output gaps
Output gaps show the level of actual real output in the economy compared to the trend output level:
-
Positive output gap: The level of actual real output in the economy is greater than the trend output level. This occurs during boom phases when the economy is producing above its sustainable capacity. The economy is "overheating."
-
Negative output gap: The level of actual real output in the economy is lower than the trend output level. This occurs during recessions when there is spare capacity in the economy. Resources are underutilised.
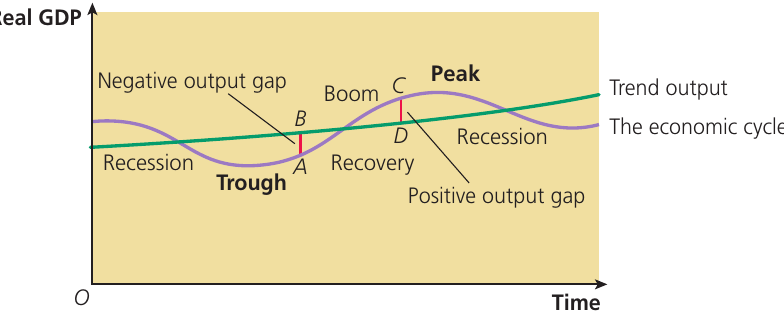
The diagram shows how output gaps change over the economic cycle. During recessions (points below trend output), there is a negative output gap. During booms (points above trend output), there is a positive output gap. At points where actual output equals trend output (like point A), there is no output gap.
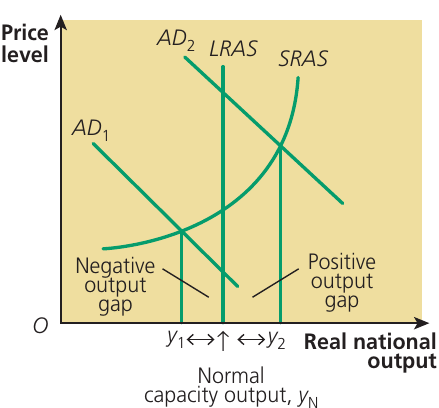
Output gaps on an AD/AS diagram
Output gaps can also be illustrated using the AD/AS macroeconomic model:
Visualising Output Gaps
-
A negative output gap occurs when the level of output is to the left of the LRAS curve and below the "normal capacity" level of output . The economy has spare capacity and is producing inside its production possibility frontier.
-
A positive output gap occurs when the economy temporarily produces at a point to the right of the LRAS curve, above the "normal capacity" level of output. This represents over-use of capacity and cannot be sustained for long.
The UK government defines economic cycles as beginning and ending when there are no output gaps - when actual output equals trend output.
Output gaps and the UK economy
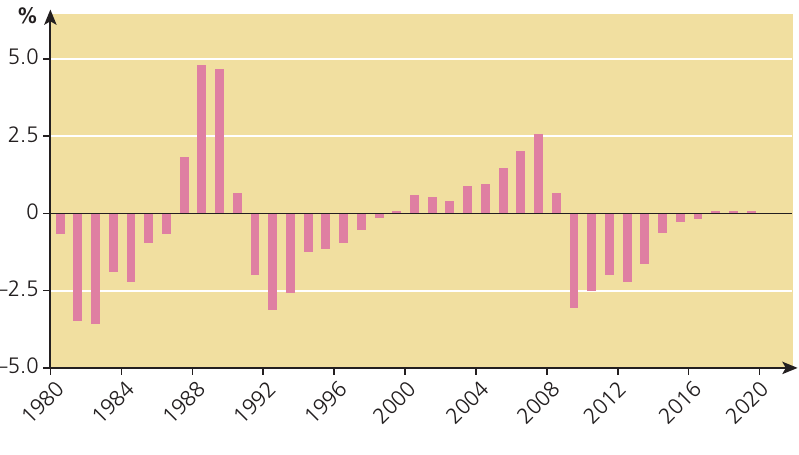
The diagram shows how UK output gaps varied between 1980 and 2020. Several patterns are evident:
Positive output gaps (bars above zero): Occurred notably in the late 1980s boom and again in the mid-2000s before the financial crisis. These periods were characterised by:
- Rapid economic growth
- Low unemployment
- Rising inflationary pressures
- Overheating economies
Negative output gaps (bars below zero): Particularly large negative gaps occurred during:
- The early 1980s recession
- The 1990-91 recession
- The 2008-09 financial crisis and its aftermath
- 2020-21 during the Covid-19 pandemic
The Long Recovery After 2008
The prolonged negative output gap after 2008 illustrates how the UK economy struggled to recover lost ground following the financial crisis. Despite slow positive growth, actual output remained well below what it would have been had the pre-recession trend continued.
By 2018, the negative output gap had largely closed, with the IMF forecasting a very small positive output gap for 2019. However, the economic disruptions of 2020-2021 made reliable estimates of potential output very difficult, as the pandemic severely affected businesses and production capacity.
Key Points to Remember:
-
Short-run growth brings idle resources into production (movement TO the PPF), whilst long-run growth expands productive capacity (outward SHIFT of the PPF).
-
The trend growth rate is the rate at which an economy can grow sustainably without causing inflationary pressure. For the UK, this has historically been around 2-2.5% but may have fallen to closer to 1-2% in recent years.
-
The economic cycle consists of four main phases: recovery, boom, recession, and trough. Actual output fluctuates around trend output throughout these phases.
-
Output gaps measure the difference between actual and trend output. Negative gaps indicate spare capacity (recession), whilst positive gaps indicate overheating (boom).
-
Economic cycles are primarily caused by fluctuations in aggregate demand driven by changes in consumer and business confidence, though supply-side shocks and other factors can also contribute to cyclical changes.
-
Remember the aggregate demand equation: - any change in these components shifts the AD curve and can trigger short-run growth or contraction.