Uses of National Income Data (AQA A-Level Economics): Revision Notes
Uses of National Income Data
Introduction to national income
National income data plays a crucial role in monitoring the performance of the UK economy. Economists use this data to track economic growth, assess living standards, and make international comparisons.
Economists measure economic activity using national income and national product (also called national output). These terms can be used interchangeably. To generate this flow of income and output, a country needs two key resources:
- Physical capital – buildings, machinery, and equipment (the national capital stock)
- Human capital – the skills, knowledge, and experience of the workforce
Understanding national income data helps policymakers make informed decisions about economic policy and allows us to assess how well an economy is performing over time.
Core concepts and definitions
National income and national product
National income refers to the flow of new output produced by an economy over a specific period (usually a year). It's measured by totalling all the income earned by factors of production (wages, rent, interest, and profit).
National product is the same concept but measured from a different angle. It represents the total value of output produced by different industries in the economy over the same period.
Both measures should give the same result because one person's expenditure is another person's income. This is known as the circular flow principle – money spent becomes income for someone else.
National capital stock
The national capital stock consists of all the capital goods (such as factories, machinery, office buildings, and equipment) that have accumulated in an economy over time. This is a stock concept – it's measured at a specific point in time, rather than over a period.
The national capital stock forms part of a country's total wealth. However, it excludes consumer goods like cars, furniture, and household appliances, even though these items have value.
Human capital
Human capital represents the skills, knowledge, and experience possessed by a country's workforce. Like physical capital, human capital is essential for production. A well-educated, highly skilled workforce can produce more output and generate higher national income.
Investment in human capital occurs through education, training, and work experience.
National wealth
National wealth is the stock of all goods and assets that exist at a point in time and have value in the economy. This includes:
- Physical capital (buildings, machinery, infrastructure)
- Consumer durables (cars, appliances, furniture)
- Land and natural resources
- Financial assets
National wealth is broader than the national capital stock. The capital stock is part of national wealth, but not all wealth is capital. For example, your family car is part of household wealth but isn't part of the nation's productive capital stock.
Understanding stocks versus flows
It's essential to distinguish between stocks and flows:
- Stocks measure variables at a specific point in time (like taking a snapshot). Examples include capital stock, wealth, and population.
- Flows measure variables over a period of time. Examples include income, output, investment, and consumption.
Think of it like a bathtub: The water level at any moment is a stock, while the water flowing from the tap is a flow. Similarly, national income is a flow generated by the stock of capital and labour.
Investment, capital stock, and economic growth
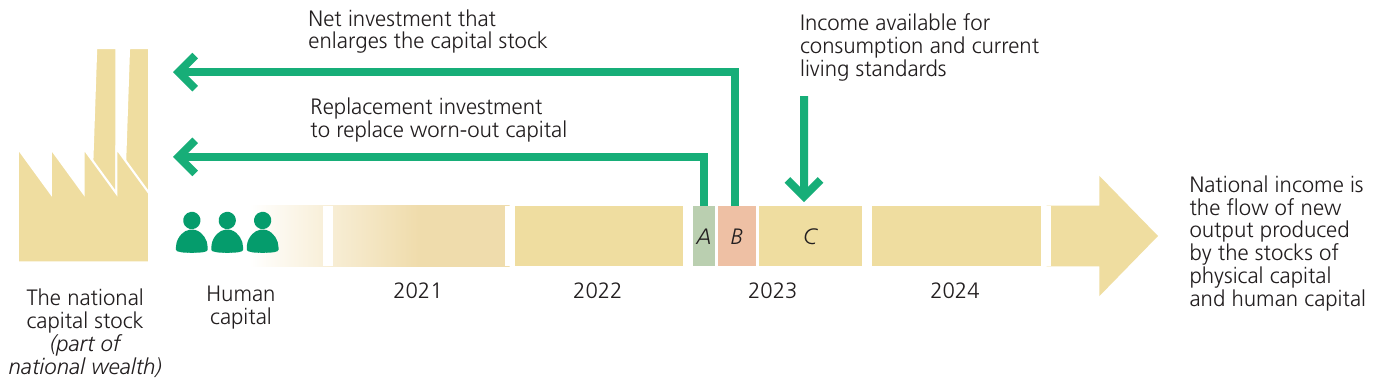
The diagram above illustrates how national income relates to capital stocks and investment over time.
Capital depreciation and replacement
As capital is used in production, it gradually wears out. This process is called depreciation or capital consumption. For example, machinery breaks down, buildings deteriorate, and vehicles need replacing.
To maintain the size of the capital stock (assuming no population growth or technical progress), some investment must replace worn-out capital. This is called replacement investment. Without it, the capital stock shrinks, and the economy's productive capacity declines, leading to negative economic growth.
Net investment and economic growth
Positive economic growth requires investment that exceeds replacement needs. The extra investment that enlarges the capital stock is called net investment.
Gross investment = Replacement investment + Net investment
Only net investment increases the size of the capital stock and enables long-run economic growth. When net investment is positive, the economy can produce more output in future periods, shifting the production possibility frontier outward.
The trade-off between consumption and investment
Consumption refers to total planned spending by households on consumer goods and services produced within the economy.
National income in any period can be divided between:
- Current consumption (goods and services consumed now)
- Investment (producing capital goods for future production)
This creates an important trade-off. If society devotes more resources to investment, fewer resources are available for current consumption. Living standards in the short term may be lower. However, increased investment enlarges the capital stock, enabling higher production and consumption in the future.
Conversely, prioritising current consumption over investment (a "live now, pay later" approach) sacrifices future growth. Less investment means slower growth in productive capacity and potentially lower living standards in the long term.
Difference between national income and GDP
Students often confuse gross national income (GNI) with gross domestic product (GDP). GDP is now the most commonly used measure of national income in the UK.
Key differences
GDP measures the flow of output produced within the economy's borders, regardless of who owns the factors of production. The word "domestic" indicates that GDP only includes production occurring within the country.
GNI measures all income earned by a country's residents, including income from assets owned abroad, minus income flowing out to overseas owners of assets located domestically.
Income flows across borders
Some UK residents and companies earn income from assets they own in other countries (such as foreign investments or overseas property). This income flows into the UK.
Similarly, some income produced within the UK flows out to overseas owners of assets located here (such as foreign-owned factories or offices in the UK).
GNI takes account of these international income flows; GDP does not.
UK example
In recent years, income flows into the UK were often larger than outflows leaving the UK, meaning UK GNI exceeded UK GDP. However, since 2011, the pattern reversed – UK GDP has been larger than GNI. In 2020, UK GNI was $2,121,181 million, while GDP was larger at $2,152,646 million.
Exam tip: Although useful to understand, GNI is not on the AQA specification. Focus on GDP (both real and nominal) as the main measure of national income.
Using national income data to assess living standards over time
National income statistics serve as important indicators of economic growth and changing living standards. However, they have significant limitations.
Real GNP per capita as an indicator
To assess how living standards change over time, economists examine real GNP per capita:
Rising real GNP per capita generally suggests improving living standards. However, this is only a rough indicator. Even if average income rises, living standards may not improve for everyone, especially if income inequality increases.
In economically developing countries, income distribution is often extremely unequal. Only a small fraction of the population may benefit materially from economic growth, while the majority see little improvement. This means average income figures can be highly misleading.
Limitations when measuring changes over time
Four main problems arise when using national income statistics to measure living standards over time:
1. The non-monetised economy
National income statistics under-estimate the true level of economic activity because much productive activity doesn't involve money payments.
Non-monetised activities include:
- Housework (cooking, cleaning, childcare)
- DIY home improvements
- Gardening and home maintenance
- Volunteer work
When measuring national income, statisticians must decide whether to estimate the value of these activities or ignore them. UK national accounts estimate some non-monetised production (like "imputed rents" for owner-occupied housing) but not all.
Practical Example: The Housework Paradox
If you pay someone $20 to clean your house, this transaction is recorded in GDP as $20 of economic activity.
If you clean your house yourself, it's not recorded at all, even though the same cleaning work occurs.
This means GDP can appear to fall when someone stops paying for a service and does it themselves, even though the same amount of productive activity is taking place.
National income statistics therefore understate true economic activity and may overstate changes in living standards when comparing periods with different levels of non-monetised activity.
2. The hidden economy
The hidden economy (also called the informal economy, underground economy, or black economy) refers to all economic transactions conducted in cash that aren't recorded in national income figures because of tax evasion.
Examples include:
- Cash-in-hand payments for services
- Unreported self-employment income
- Illegal economic activities
The gap between GDP totals calculated using the income method and the expenditure method can help estimate the hidden economy's size. In the UK, the hidden economy probably equals about 10% of measured GNP. In some countries like Greece and Italy, estimates suggest 20-30% of GNP.
Like the non-monetised economy, the hidden economy means national income statistics understate the true level of economic activity.
3. Quality changes
Over time, the quality of goods and services changes – usually improving, though sometimes deteriorating.
Quality improvements create measurement problems:
- New products and services appear
- Existing products become more sophisticated
- Technology improves performance
Technology Example: Smartphones
A smartphone today offers vastly more features and capabilities than mobile phones from 20 years ago – internet access, high-quality cameras, GPS navigation, thousands of apps – yet they may cost similar amounts when adjusted for inflation.
National income statistics struggle to fully capture this quality improvement. The price might be the same, but the value to consumers is much higher.
Quality deterioration also causes problems:
- If public transport becomes less reliable, GNP may rise (as more repairs are needed) even though welfare falls
- If healthcare services deteriorate, recorded spending may increase while actual well-being declines
These measurement difficulties mean national income statistics may not accurately reflect true changes in living standards.
4. Negative externalities
National income statistics over-estimate living standards because of negative externalities such as pollution, congestion, and crime-related costs.
The problem: Activities that reduce welfare often show up as increasing national output, creating an apparent welfare gain.
Examples:
- Increased traffic congestion raises the value of national income (more fuel consumed, more vehicle repairs needed) but reduces welfare (lost leisure time, increased stress)
- Environmental pollution from production increases measured output but damages health and reduces quality of life
- Crime prevention and security services add to GDP but represent a defensive expenditure that wouldn't be needed in a crime-free society
Real-World Example: The Traffic Congestion Paradox
As roads become more congested:
- Motorists spend more on petrol (sitting in traffic uses fuel)
- Vehicle maintenance costs rise (more wear and tear)
- Healthcare costs increase (stress-related illness)
All these expenditures increase measured national income, but overall welfare falls because people have less leisure time and poorer health. The economy appears to be growing, but people are actually worse off.
Using national income data to compare living standards between countries
International comparisons of living standards face all the problems mentioned above, plus several additional challenges.
Relative importance of the non-monetised economy
Comparisons of national income per head between countries can be misleading if the relative importance of non-monetised economies differs significantly.
Key issues:
- Different countries have different proportions of non-monetised activity
- Statistical sophistication varies between developed and developing countries
- Methods of classifying and categorising national accounts lack international uniformity
Development Level Comparison
In economically developing countries, subsistence farming and home production are much more important than in developed economies.
A farmer in a developing country who grows their own food contributes little to measured GDP. A farmer in a developed country selling produce commercially contributes fully to GDP.
This makes direct GDP comparisons misleading – the developing country farmer may have adequate food and reasonable living standards, but appears "poorer" in the statistics.
Climate differences also matter. Countries with cold winters need to spend more on fuel, heating, and warm clothing. Countries with warmer climates can meet these needs naturally. Higher measured expenditure in cold countries doesn't necessarily indicate higher real living standards.
Exchange rate problems
To compare GDP per capita across countries, we need to convert different currencies into a common currency (typically US dollars). However, this creates significant problems.
Market exchange rates may not accurately reflect the real purchasing power of currencies. Exchange rates are influenced by:
- International trade in goods and services
- Financial capital flows
- Speculation
- Government intervention
Exchange rates correctly reflect only the values of internationally traded goods like cars, electronics, and commodities. They don't accurately reflect the prices of non-traded goods and services that don't enter international trade.
Traded versus non-traded goods
The purchasing power of a currency over domestically produced goods that don't enter international trade may differ completely from its purchasing power over imported goods.
Non-traded goods and services include:
- Haircuts and personal services
- Restaurant meals
- Local transport
- Housing
- Many professional services
Key pattern: In developing countries, non-traded goods and services tend to be much cheaper than in developed countries. This is because wages are lower in developing countries, making labour-intensive services relatively inexpensive.
Service Price Comparison
A taxi ride covering the same distance:
- Paris or London: $30-40
- Lima or Lahore: $3-5
This reflects wage differences, not differences in the service quality. The taxi ride provides the same utility, but costs dramatically different amounts.
Impact on comparisons: When developing countries' GDP figures are measured in US dollars using market exchange rates, they tend to under-estimate real income levels and living standards. The exchange rate conversion doesn't capture how much more purchasing power the local currency has over domestically produced goods and services.
Purchasing power parity exchange rates
What is PPP?
The solution to the exchange rate problem is to use purchasing power parity (PPP) exchange rates.
PPP exchange rates are rates of currency conversion that equalise the purchasing power of different currencies by eliminating differences in price levels between countries.
In the long run, exchange rates should move toward rates that equalise the prices of an identical basket of goods and services in any two countries. For example, a dollar should buy the same amount everywhere. Purchasing power is determined by the relative cost of living and inflation rates in different countries.
PPP means equalising the purchasing power of two currencies by taking into account the cost of living and inflation differences between them. It's about what money can actually buy, not just the exchange rate.
How PPP addresses exchange rate problems
Standard GDP comparisons using market exchange rates tend to over-estimate the cost of living in poorer developing countries.
PPP exchange rates are based on the idea that exchange rates should adjust to equalise the prices of an identical basket of goods and services across countries. By using PPP rates instead of market exchange rates, we get more accurate comparisons of real living standards.
PPP Calculation Example
If a basket of goods costs:
- £100 in the UK
- $150 in the US
The PPP exchange rate would be: £1 = $1.50
This is true regardless of what the market exchange rate currently is. PPP focuses on actual purchasing power, not market speculation or capital flows.
Advantages of PPP
Stability: PPP exchange rates are relatively stable over time. Market rates are volatile and can swing dramatically due to speculation, financial flows, or policy changes. Using market rates could produce large swings in measured living standards even when real conditions haven't changed much. PPP rates avoid this problem.
Better reflection of non-traded goods: PPP takes account of the prices of both traded and non-traded goods. A haircut in New York may be more expensive than in Lima, and a taxi ride costs more in Paris than in Tunis. PPP recognises these differences. Because wages tend to be lower in poorer countries, labour-intensive services are cheaper there, giving local currency greater purchasing power than market exchange rates suggest.
More accurate welfare comparisons: For these reasons, PPP is generally regarded as a better measure of overall well-being when comparing living standards across countries.
Drawbacks of PPP
Despite its advantages, PPP has important limitations:
Measurement difficulty: PPP is much harder to measure than market-based exchange rates. Creating PPP rates requires conducting extensive price surveys across many countries for thousands of products. This is a huge statistical undertaking, and new comparisons are available only infrequently (not annually).
Incomplete country coverage: The methodology doesn't cover all countries, meaning data is missing for some nations. For those countries included, estimates may need to be made where data gaps exist.
Infrequent updates: An update for 2020 was produced covering recent years. However, each participating country (176 in total) provides average prices for 1,000 closely specified products. This massive data collection exercise means updates happen only every few years, not annually like market exchange rates.
The Big Mac index

In 1986, The Economist magazine created the Big Mac index as a light-hearted guide to whether currencies are at their "correct" level.
The Big Mac index is based on purchasing power parity theory. In the long run, exchange rates should move toward rates that equalise the prices of an identical basket of goods and services in any two countries – in this case, a Big Mac burger.
Why a Big Mac?
- Available in nearly identical form in many countries around the world
- Contains a standardised mix of ingredients (bread, meat, lettuce, cheese, sauce)
- Produced using local labour, so reflects local wage levels
- Easy to compare prices internationally
The Big Mac index was never intended as a precise gauge of currency misalignment. Rather, it makes exchange rate theory more accessible and understandable. The GDP-adjusted Big Mac index addresses one criticism: you'd expect burger prices to be cheaper in poor countries than rich ones because labour costs are lower.
PPP theory suggests that as countries like China become richer, exchange rates should move toward levels that equalise burger prices across countries in the long run.
Summary
Key Points to Remember:
-
National income measures the flow of new output produced in an economy over a period, while national wealth is the stock of assets at a point in time. Don't confuse stocks and flows.
-
Economic growth requires net investment – investment that exceeds the amount needed to replace worn-out capital. Remember: Gross investment = Replacement investment + Net investment.
-
National income statistics underestimate true economic activity because they miss the non-monetised economy (unpaid work) and the hidden economy (unreported cash transactions).
-
When comparing living standards over time, watch out for four main limitations:
- Non-monetised economy
- Hidden economy
- Quality changes
- Negative externalities
-
When comparing living standards between countries, additional problems arise:
- Different sizes of non-monetised economies
- Exchange rate distortions
- Different prices for traded versus non-traded goods
-
Purchasing power parity (PPP) exchange rates provide more accurate international comparisons than market exchange rates because they account for differences in price levels and cost of living between countries. However, PPP rates are harder to measure and available less frequently.