Demand for Labour (AQA A-Level Economics): Revision Notes
Demand for Labour
Introduction: Labour markets and factor markets
Labour markets operate as factor markets, which are markets where the services of factors of production (such as labour, land, and capital) are bought and sold. Understanding labour markets is essential because they determine wages and employment levels across the economy.
In labour markets, the roles of households and firms are reversed compared to goods markets:
- Goods markets: Firms supply → Households demand
- Labour markets: Households supply → Firms demand
Households supply labour (workers seeking employment) whilst firms demand labour (employers seeking workers).
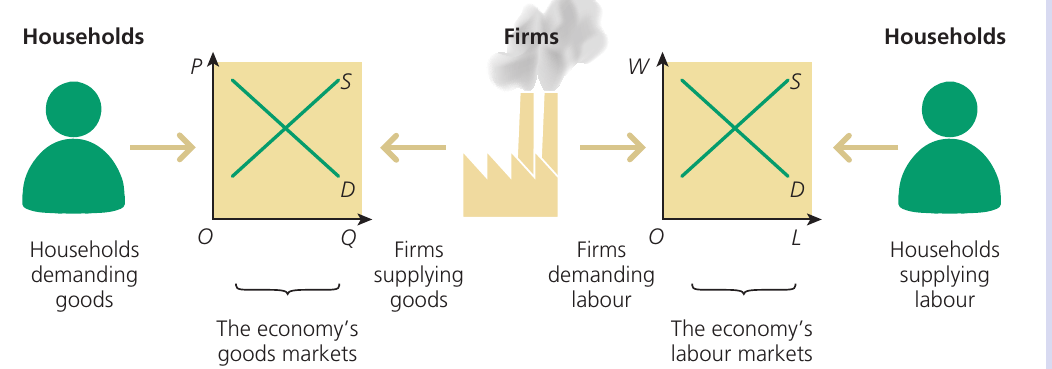
The circular flow of income connects these two markets. Households earn incomes by selling their labour services to firms in labour markets. They then use these incomes to purchase goods and services from firms in goods markets. This creates a continuous flow of money and resources throughout the economy.
Derived demand for labour
A crucial concept in labour economics is that the demand for labour represents a derived demand. This means that firms do not want labour for its own sake. Instead, they demand labour only because it helps them produce goods and services that consumers want to buy.
Key term: Derived demand refers to demand for a factor of production that exists only as a consequence of demand for something else (the final goods or services).
Practical Example: The Bakery
A bakery only employs bakers because customers demand bread and cakes. If consumer demand for baked goods falls, the bakery's demand for bakers will also decrease. This makes labour demand fundamentally different from consumer demand for goods, which is typically wanted for direct consumption.
The derived nature of labour demand has important implications. Without profitable sales of output in the goods market, firms have no economic reason to employ workers in the long run. This means that labour market conditions are closely linked to conditions in goods and services markets.
Marginal productivity theory and the demand for labour
The marginal physical product of labour
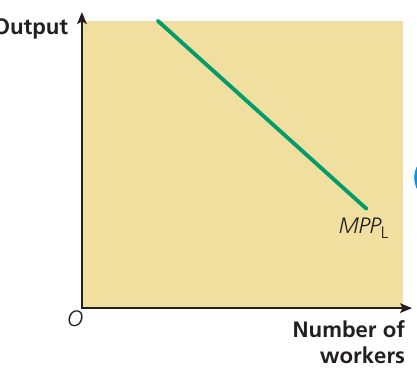
To understand how firms decide how many workers to employ, we need to examine the marginal physical product of labour (). This concept measures the additional output produced when a firm employs one more worker, whilst holding all other inputs (particularly capital equipment) constant.
Key term: Marginal physical product of labour () represents the addition to a firm's total output brought about by employing one extra worker.
The Law of Diminishing Returns
When a firm adds more workers to a fixed amount of capital equipment, the eventually falls. This happens because each additional worker has progressively less capital to work with, making them less productive than previous workers.
Worked Example: Wheelbarrow Manufacturing
Consider a wheelbarrow manufacturing business. The table below shows how total output changes as more workers are employed:
| Size of labour force | Total physical product of labour (wheelbarrows per week) |
|---|---|
| 0 | 0 |
| 1 | 5 |
| 2 | 12 |
| 3 | 21 |
| 4 | 31 |
| 5 | 40 |
| 6 | 46 |
| 7 | 50 |
| 8 | 51 |
| 9 | 51 |
| 10 | 49 |
Calculating :
- First worker adds: 5 wheelbarrows
- Second worker adds: 7 wheelbarrows (12 - 5)
- Third worker adds: 9 wheelbarrows (21 - 12)
- Fourth worker adds: 10 wheelbarrows (31 - 21)
Notice: After the fourth worker, each additional worker adds progressively less output. The eighth worker adds only 1 wheelbarrow, the ninth adds nothing, and the tenth actually reduces total output by 2 wheelbarrows (negative marginal product).
This pattern illustrates diminishing marginal productivity. Initially, the business benefits from increasing marginal returns as workers can specialise and work more efficiently together. However, eventually the fixed capital (tools, workspace, equipment) becomes overcrowded, and additional workers become less productive.
The marginal revenue product of labour
Whilst the tells us about physical output, firms make employment decisions based on the financial value that workers add. This brings us to the marginal revenue product of labour (), which represents the monetary value of the additional output produced by employing one more worker.
Key term: Marginal revenue product of labour () is the money value of the addition to a firm's total output brought about by employing one more worker.
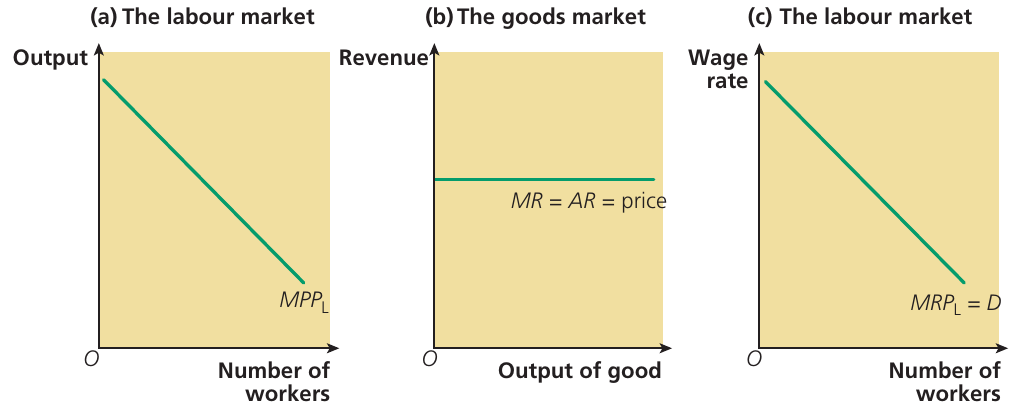
To calculate the , we need to convert the physical output () into revenue. This requires knowing the price or marginal revenue from selling the additional output:
Formula:
In a perfectly competitive goods market, where firms are price-takers, marginal revenue equals average revenue which equals price (). This simplifies the formula to:
Formula (perfect competition):
Worked Example: Calculating
If an additional worker produces 5 wheelbarrows () and each wheelbarrow sells for \£60, then:
This \£300 represents the value that the extra worker adds to the firm's total revenue.
The curve, like the curve, slopes downward due to diminishing marginal productivity. As more workers are employed, each additional worker adds less physical output and therefore less revenue. This downward-sloping curve is crucial because it forms the firm's demand curve for labour.
Exam tip: Make sure you understand the difference between marginal physical productivity (measured in units of output) and marginal revenue productivity (measured in monetary terms). Questions often test this distinction.
The demand curve for labour
What a demand curve for labour shows
The demand curve for labour illustrates the relationship between the wage rate and the quantity of labour that firms wish to employ. The lower the wage rate, the more workers a firm or market will be willing to hire.
A firm will continue hiring workers as long as the revenue generated by an additional worker () exceeds or equals the cost of employing that worker (the wage rate). This means that under perfect competition, the firm's curve is effectively its demand curve for labour. The firm maximises profit by employing workers up to the point where:
Exam tip: Remember that the curve represents a firm's demand for labour under perfect competition. It shows how many workers the firm will employ at different wage rates.
Individual firm demand versus market demand
It is important to distinguish between a single firm's demand for labour and the entire labour market's demand for labour.
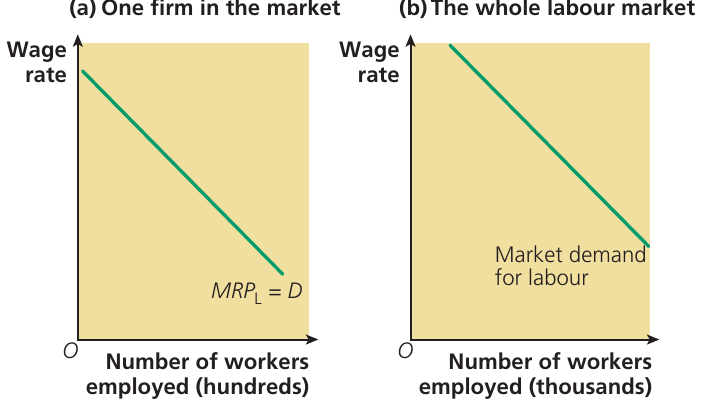
A single firm's demand curve for labour is its curve, which shows the relationship between the wage rate and the number of workers that individual firm wishes to employ. The scale is typically measured in hundreds of workers.
The market demand curve for labour represents the combined demand from all firms operating in that particular labour market. It is derived by horizontally summing all the individual firms' demand curves ( curves). When we add up all the firms' labour demands at each wage rate, we get the total market demand. The scale here is typically measured in thousands or millions of workers, depending on the size of the market.
The market demand curve, like individual firm demand curves, slopes downward from left to right. This negative slope reflects the fact that at lower wage rates, all firms collectively will employ more workers, whilst at higher wage rates, firms reduce their workforce.
Factors shifting the demand curve for labour
The market demand curve for labour can shift to the right (an increase in demand) or to the left (a decrease in demand) for several important reasons.
Study tip: Don't confuse a movement along a demand curve for labour (caused by a change in the wage rate) with a shift of the entire demand curve (caused by factors other than wage rates).
- Movements along the curve: Changes in the quantity of labour demanded at different wages
- Shifts of the curve: Changes in demand at all wage levels
Changes in labour productivity
Labour productivity refers to the output produced per worker. When labour productivity increases, the curve shifts upward, meaning each worker can now produce more output than before.
If labour productivity rises across an industry or occupation, this increases the at each wage rate, causing the demand curve for labour to shift to the right. Firms find workers more valuable because they produce more output, so more labour is demanded at every wage level. The entire market demand curve for labour shifts rightward when all firms experience higher labour productivity.
Conversely, if labour productivity falls, the demand curve for labour shifts to the left. This is less common but could occur if, for example, workers lose access to important tools or if working conditions deteriorate.
Changes in labour productivity can result from various factors including:
- Better training programmes
- Improved management practices
- Higher worker motivation
- Better quality capital equipment to work with
Changes in technology
Technological change can shift the demand curve for labour, but the direction of the shift depends on the specific nature of the technological change.
Technology that complements labour: When technical progress makes workers more productive relative to other factors of production, it increases the and causes the demand curve for labour to shift to the right. For instance, giving construction workers better power tools increases their productivity, making firms want to employ more workers at any given wage rate.
Additionally, if technological improvements reduce production costs and lower the price of the product, this can increase consumer demand for the good. Higher demand for the final product increases the derived demand for the labour needed to produce it, again shifting the labour demand curve rightward.
Technology that substitutes for labour: However, technical progress can also have the opposite effect. If new technology allows firms to substitute capital for labour (such as introducing automated production methods or robots), this reduces the demand for labour and shifts the demand curve to the left. Workers become relatively less important in the production process, and firms require fewer workers to produce the same output.
Technological Unemployment
Technological unemployment can result when labour-saving technology displaces workers. This represents a form of structural unemployment, where workers' skills become obsolete due to technological change. Some workers may lose their jobs entirely, particularly if they lack the skills needed to work with new technologies.
The net effect of technological change on labour demand therefore depends on whether the technology primarily complements workers (increasing demand) or substitutes for them (decreasing demand).
Elasticity of demand for labour
The elasticity of demand for labour measures how responsive the quantity of labour demanded is to changes in the wage rate. Understanding this concept is crucial for predicting how wage changes will affect employment levels.
Key term: Elasticity of demand for labour is the proportionate change in the quantity of labour demanded following a change in the wage rate.
Formula:
The demand for a particular type of labour is likely to be relatively inelastic (insensitive to wage changes) when:
-
Labour costs are a small proportion of total production costs - Sometimes called "the importance of being unimportant". If wages represent only a tiny fraction of total costs, firms can absorb wage increases without significantly affecting profitability, so employment remains relatively stable.
-
Demand for the final product is inelastic - When consumers continue buying the product regardless of price changes, firms can pass wage cost increases onto consumers through higher prices without losing many sales. This means they don't need to reduce employment much when wages rise.
-
Labour is difficult to substitute - When workers possess specialised skills or when the production process requires human judgment and creativity that machines cannot replicate, firms have little choice but to employ workers even if wages rise. There are no good alternatives available.
-
The short run rather than the long run - In the short run, firms often cannot quickly adjust their production methods. Changing how products are made takes time, so firms continue employing workers at similar levels even when wages change. Over the long run, however, firms can reorganise production, adopt new technologies, or relocate, making labour demand more elastic.
Worked Example: Calculating the Effect of a Wage Increase on Employment
Consider a trade union representing 20,000 unskilled workers who currently earn \£10 per hour. The union negotiates a 50p per hour wage increase (a 5% increase). Research shows that the employer's wage elasticity of demand for unskilled workers is .
Step 1: Start with the elasticity formula
Step 2: Rearrange to solve for the change in quantity demanded
Step 3: Substitute the values
Step 4: Calculate the employment effect
Given that 20,000 workers currently have jobs, a 50% reduction means that:
Conclusion: This example demonstrates that when labour demand is highly elastic (the elasticity value is large in absolute terms), even modest wage increases can lead to substantial job losses. Trade unions must consider these trade-offs when negotiating wage increases.
Study tip: Remember not to confuse the slope of a demand curve with its elasticity. Elasticity varies along a demand curve, even if the slope remains constant.
Case study: Labour shortages in the fruit-picking market

The UK soft-fruit industry provides a practical illustration of labour demand concepts. In summer 2018, three out of five soft-fruit growers struggled to recruit the 30,000 seasonal workers needed for harvesting. Several factors affected the demand for and supply of fruit pickers:
Demand side factors:
- Soft-fruit production in the UK grew by 131% between 1998 and 2018, driven by increased consumer demand for home-grown strawberries (now protected from bad weather by plastic sheeting)
- The industry became worth over \£1.2 billion in 2018
- This increase in demand for fruit increased the derived demand for fruit pickers
- The labour market was "definitely tightening" as demand for workers exceeded supply
Supply side factors:
- Brexit and fears about future immigration rules deterred eastern European workers from coming to the UK
- Falling unemployment in Bulgaria and Romania meant fewer people needed to seek work abroad
- Uncertainty over immigration rules and a weakened British currency (meaning less money to send home) reduced the attractiveness of UK farm work
Market Implications
Despite the high demand for labour and wages being paid at the national living wage (\£7.83 per hour at the time, plus benefits like accommodation and productivity bonuses), the supply of willing workers fell short. One recruitment agency reported "absolutely no appetite for the jobs among British workers."
Farmers called on the government to open immigration more widely to seasonal workers from outside the EU, but the UK's Brexit decision made this politically complicated. Without sufficient labour supply, many producers faced uncertainty about whether fruit would be left to rot on stems. Some growers had already scaled back investment or were considering expanding operations in different countries.
This case study demonstrates how derived demand works in practice (demand for fruit pickers depends on consumer demand for fruit), how labour market equilibrium can be disrupted by external shocks (Brexit), and how inelastic labour demand can be in the short run (even with labour shortages, farmers could not quickly substitute capital for labour in fruit picking).
Remember: Key Points to Take Away
-
Labour markets are factor markets where households supply labour and firms demand labour, with roles reversed compared to goods markets.
-
Demand for labour is a derived demand because firms only want workers when there is consumer demand for the goods and services these workers help produce.
-
The marginal physical product of labour () measures the additional physical output from employing one more worker and typically falls due to the law of diminishing returns.
-
The marginal revenue product of labour () equals multiplied by the price (or marginal revenue) and represents the monetary value a worker adds. Under perfect competition, the curve is the firm's demand curve for labour.
-
The demand curve for labour slopes downward because of diminishing marginal productivity, and the market demand curve is the horizontal sum of all individual firms' demand curves.
-
The demand curve for labour shifts when labour productivity changes or when technology changes (either complementing or substituting for labour).
-
Elasticity of demand for labour measures responsiveness of employment to wage changes and is influenced by labour's share of costs, demand for the final product, substitutability of labour, and the time period considered.