Run-off Variation (AQA A-Level Geography): Revision Notes
Run-off variation
Understanding discharge
Rivers are dynamic systems that respond to changes in rainfall, temperature and human activity. To understand these responses, geographers measure how much water flows through rivers at different times. This measurement is central to managing water resources, predicting floods and designing infrastructure like bridges and flood defences.
Discharge describes the volume of water passing a specific point in a river during a given time period. It is calculated by multiplying the cross-sectional area of the river channel by the velocity of the water at the measuring point. Discharge is measured in cubic metres per second (m³/s), commonly referred to as cumecs.
Worked Example: Calculating Discharge
If a river has a cross-sectional area of 10 m² and the water flows at 2 metres per second, the discharge would be:
Discharge = Cross-sectional area × Velocity Discharge = 10 m² × 2 m/s = 20 m³/s (or 20 cumecs)
Measuring discharge in the UK
The UK maintains an extensive network of around 1,500 gauging stations to monitor river discharge across the country. These stations are supported by additional temporary monitoring sites, creating a comprehensive system for tracking water flow patterns.
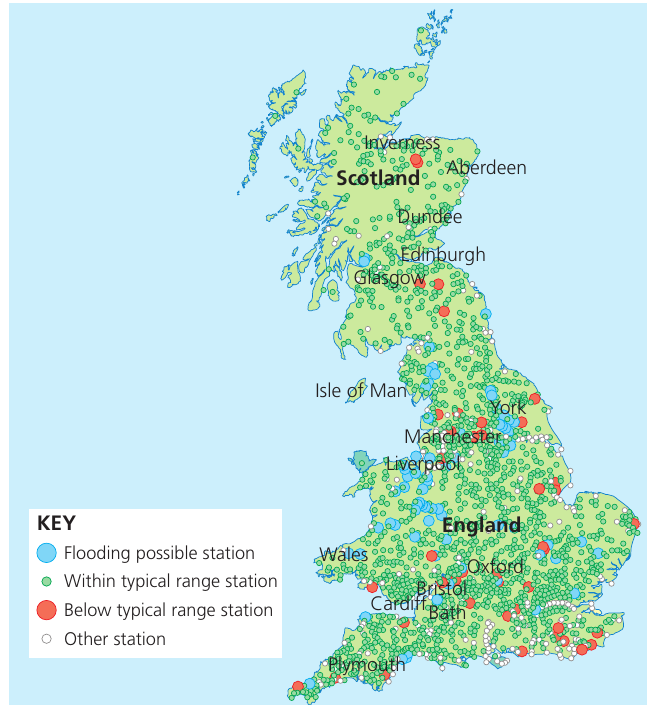
Such a large network is necessary because the UK contains numerous small river basins with diverse characteristics. Each basin responds differently to rainfall based on its climate, topography, geology, land use and water management practices.
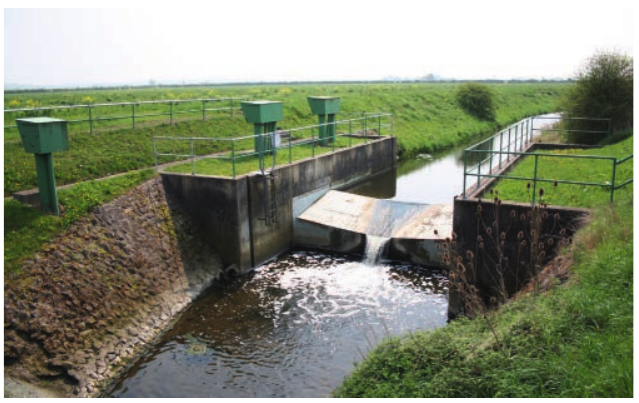
Many gauging stations use weirs - structures built across rivers that allow water to flow over them. The depth of water flowing over the weir is directly proportional to the discharge, enabling accurate measurements through simple calculations.
Continuous monitoring of river discharge serves several crucial purposes:
- It helps identify and quantify long-term hydrological trends, particularly important as climate change affects precipitation patterns
- The data informs the design of water-related infrastructure including reservoirs, bridges, flood banks, urban drainage schemes and sewage treatment works
- It supports flood warning and alleviation schemes
- It guides hydroelectric power development
- It protects the ecological health and recreational value of watercourses and wetlands
River regimes
River regime is defined as the variability in discharge throughout the year in response to precipitation, temperature, evapotranspiration and drainage basin characteristics.
Rivers exhibit characteristic flow patterns that reflect their environmental setting. A river regime describes how discharge changes through the seasons, shaped by when and how much precipitation falls, temperature variations that affect evapotranspiration, and the physical properties of the drainage basin.
The UK contains approximately 1,500 river systems, each with its own regime. These rivers are extremely sensitive to climatic variation, land use changes and water abstraction. Their regimes are also heavily influenced by the landscapes through which they flow. UK rivers range from mountain torrents in upland areas receiving five metres of rain annually, to placid groundwater-fed streams in parts of southeast England with much lower rainfall.
Across the UK, rainfall is fairly evenly distributed throughout the year, with a slight autumn and winter maximum, particularly in western regions. However, seasonal variations in temperature and sunshine create marked differences in evapotranspiration losses. These losses concentrate heavily in the summer months, meaning UK rivers typically show a distinct seasonality in their discharge patterns, with a late summer or early autumn minimum.
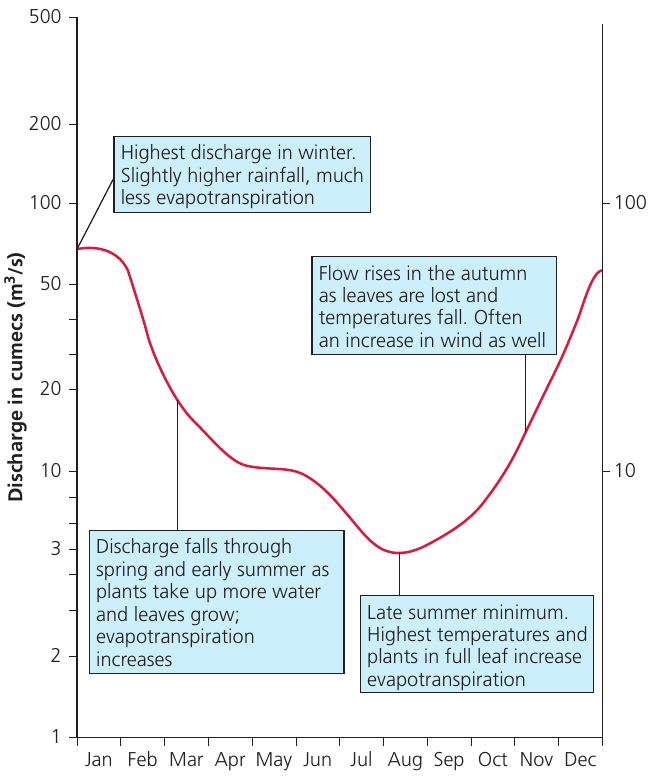
The River Avon in Bath demonstrates a typical UK river regime. Discharge is highest during winter months when rainfall is elevated and evapotranspiration is reduced due to lower temperatures and less vegetation activity. In spring and early summer, discharge declines as vegetation takes up more water and evapotranspiration increases. The late summer minimum occurs when temperatures peak and plants are in full leaf, maximizing water loss. Flow recovers in autumn as leaves fall and temperatures drop, reducing evapotranspiration rates.
International comparison: the Mohawk River, USA
River regimes differ considerably around the world. The Mohawk River, which flows from the mountains of upper New York State in the USA, shows a markedly different pattern from UK rivers due to its continental climate with extremely cold, snowy winters and hot summers.
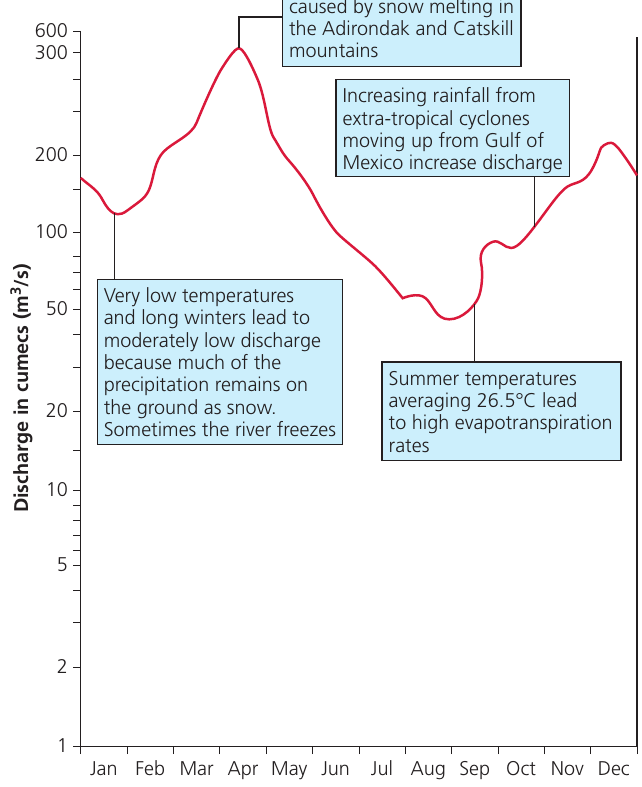
The Mohawk experiences very low discharge during winter because extremely cold temperatures and long winters cause precipitation to remain as snow on the ground. Sometimes the river itself freezes, further reducing flow. In spring, particularly April, discharge reaches its annual peak as snow melts from the Adirondack and Catskill mountains. During late summer and early autumn, discharge falls to its annual minimum due to high evapotranspiration rates driven by summer temperatures averaging 26.5°C. In late autumn and early winter, discharge increases again as extra-tropical cyclones move up from the Gulf of Mexico, bringing additional precipitation.
Geological influences on river regimes
The geological characteristics of individual catchments exert a major influence on flow patterns. This is clearly demonstrated when comparing two neighbouring rivers in the Thames basin that experience almost identical climatic conditions.
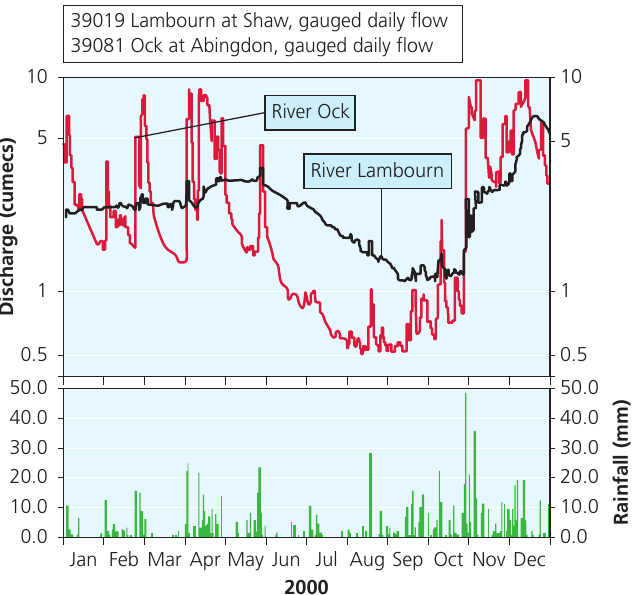
The River Ock at Abingdon and the River Lambourn at Shaw receive the same rainfall throughout the year, yet their discharge patterns differ markedly.
The Lambourn, supplied by springs emerging from the underlying chalk, maintains a much less variable flow regime. The permeable chalk acts as a natural reservoir, storing water during wet periods and slowly releasing it during dry spells, resulting in steady discharge.
The Ock, which drains an impermeable clay catchment, responds rapidly to rainfall events. Water cannot infiltrate the clay easily, so it quickly reaches the river channel via overland flow, creating a jagged hydrograph with sharp peaks and troughs.
Storm hydrographs
Rainfall events introduce short-term variability into river flow patterns. While river regimes show seasonal patterns, individual storms create sudden changes in discharge that can be studied using storm hydrographs.
Storm hydrograph is a graph showing river discharge over the time period when normal flow is affected by a storm event. Also known as a flood hydrograph, it shows how a river responds to a rainfall event (storm flow).
Storm hydrographs are important tools for predicting how rivers might respond to rainstorms, which helps in managing flood risk. Understanding the shape of a hydrograph allows water managers to anticipate potential flooding and take appropriate action.
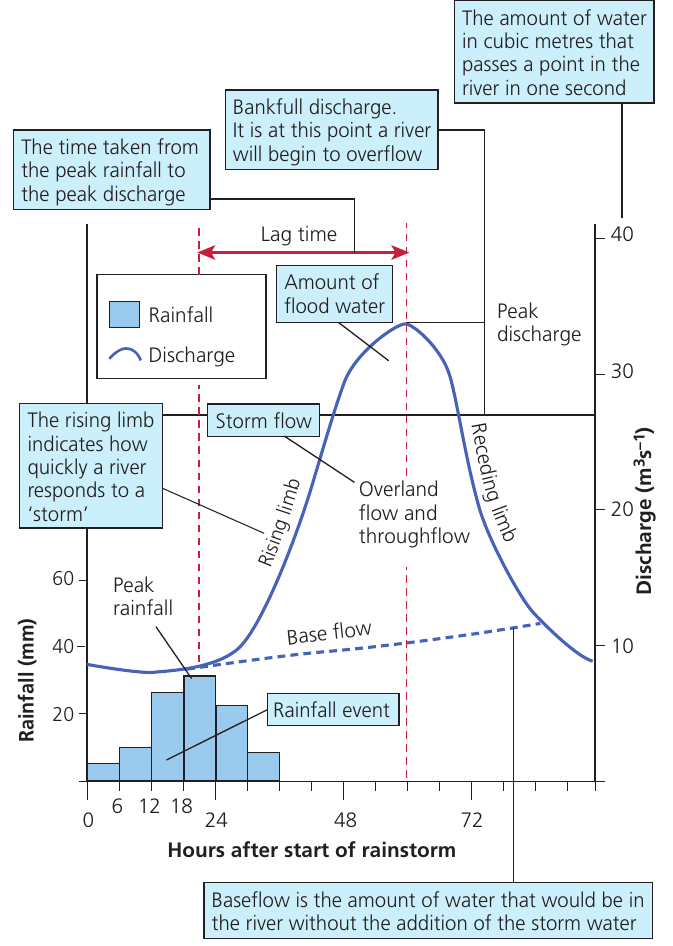
A storm hydrograph has several key components that work together to show the river's response to rainfall:
Base flow represents the normal day-to-day discharge of the river. This water comes from slow-moving throughflow in the soil and groundwater seeping into the river channel. It provides a constant background flow even without recent rainfall.
Storm flow is the additional discharge resulting from storm precipitation. It involves water reaching the river through multiple pathways: overland flow across the surface, throughflow moving laterally through the soil, and some contribution from groundwater flow.
The rising limb indicates how quickly a river responds to a storm. When rain falls, water enters the drainage basin and begins feeding the river through faster-moving pathways. The steepness of the rising limb shows the speed of this response.
Peak discharge represents the point when river discharge reaches its greatest level. This is the most critical moment for flood risk assessment.
Lag time measures the delay between peak rainfall and peak discharge. This delay occurs because water takes time to move through the drainage basin and reach the measuring point on the river.
The receding limb shows how discharge falls after the storm passes. Once all the storm water has moved through the river system, discharge returns to base flow levels.
Bankfull discharge is the maximum discharge that a river channel can carry without overflowing its banks and causing flooding.
When discharge exceeds bankfull capacity, water spills onto the floodplain, creating flooding conditions.
Physical factors affecting storm hydrographs
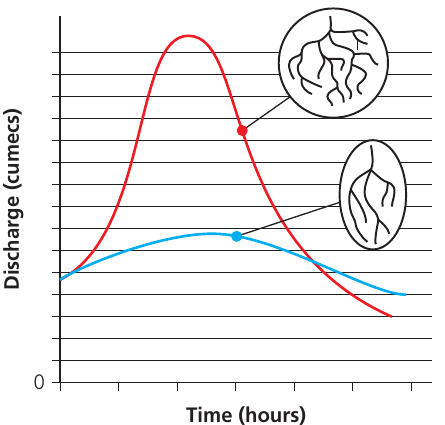
Storm hydrographs vary considerably in shape depending on both natural and human factors. Some hydrographs are described as "flashy" - characterized by short lag times, high peak discharge, and steep rising and falling limbs. Others are more "subdued" with gentle rising and falling limbs, long lag times and low peak discharge. These differences are determined by various physical and human factors.
Drainage basin shape
The shape of a drainage basin significantly affects how quickly water reaches the measuring point on a river. Circular basins tend to produce flashier hydrographs than elongated basins. This occurs because in a circular basin, water from all parts of the catchment reaches the measuring point in roughly the same amount of time. All the water arrives together, creating a sharp, high peak. In contrast, elongated basins spread out the arrival times because water from distant parts of the catchment takes longer to reach the measuring point than water from nearby areas.
Gradient and steepness
Drainage basins with steep sides generate flashier hydrographs than gently sloped basins. On steep slopes, water flows more quickly whether as throughflow beneath the surface or overland flow across it. This rapid movement gets water to the river channel much faster. Additionally, steep-sided basins typically have thinner soils that become saturated more quickly, encouraging overland flow and further reducing lag time.
Drainage density
Basins with high drainage density - meaning they have many surface streams acting as tributaries to the main river - produce flashy hydrographs. When numerous stream channels are present, water has less distance to travel overland before entering a defined channel. Since channelized flow is faster than overland flow, all the water arrives at the measuring station simultaneously, creating a sharp peak discharge.
Rock and soil type
The permeability of the underlying geology fundamentally shapes hydrograph characteristics. If a drainage basin is already saturated from antecedent (previous) rainfall, any new precipitation will run off as overland flow because the ground cannot absorb more water. Since overland flow is the fastest pathway for water to reach rivers, this reduces lag time and increases peak discharge, creating a flashy response.
When soil or rock within the river basin is impermeable - such as clay soils or shale rocks - overland flow dominates because water cannot infiltrate. Throughflow and infiltration are greatly reduced. This lack of natural water storage means rain rapidly converts to river discharge, producing flashy hydrographs.
Conversely, drainage basins underlain by permeable rocks like sandstone create subdued hydrographs. Water soaks into the porous rock, slowing its journey to the river and releasing it gradually over time through groundwater seepage.
Vegetation cover
Thick vegetation significantly affects storm hydrographs in several ways:
- Vegetation intercepts precipitation, holding water on leaf surfaces where it evaporates or slowly drips to the ground. This delays the movement of rainwater to channels
- Plant roots reduce overland flow by creating pathways for water to infiltrate into the soil
- Vegetation removes water through evaporation from leaf surfaces and transpiration through roots, reducing the total amount reaching the river
These processes combine to create subdued storm hydrographs with increased lag time and reduced peak discharge.
When vegetation is sparse or absent, interception is minimal and infiltration may be reduced, leading to increased overland flow and flashier hydrographs.
Surfaces baked hard by prolonged sunshine during dry weather, or frozen during cold conditions, also reduce infiltration, producing flashy responses when rain eventually falls.
Precipitation characteristics
The amount and intensity of precipitation can significantly affect storm hydrographs. Heavy storms that deliver large quantities of water to the drainage basin over a short time period result in higher discharge.
The type of precipitation also matters. When precipitation falls as snow rather than rain, the lag time is likely to be much greater. Snow must accumulate on the ground and then melt before water enters the river channel. When rapid snowmelt occurs, perhaps during a sudden temperature increase, peak discharge can be very high.
Size of drainage basin
Large drainage basins capture more precipitation and therefore typically have higher peak discharge compared to smaller basins. However, smaller basins generally experience shorter lag times because precipitation does not have as far to travel to reach the measuring point.
Human factors affecting storm hydrographs
Human activities can dramatically alter the natural hydrological response of drainage basins, often with significant consequences for flood risk.
Deforestation
Removing forests reduces interception rates, allowing rainwater to hit the surface directly. The lack of vegetation roots also reduces the infiltration rate into soil. Both factors result in rapid overland flow and flashy hydrographs.
Deforestation also exposes soil to greater rates of erosion. Without tree roots binding the soil together, sediment is easily washed into river channels. This sedimentation reduces the bankfull capacity of rivers, meaning they can carry less water before overflowing and causing flooding.
Tropical South America contains the world's largest continuous tropical forest and savanna ecosystems, particularly the Amazon rainforest. This region is environmentally crucial not only for its high biodiversity but also because it generates more than a quarter of the world's river discharge. However, the Amazon basin has experienced explosive development and deforestation over the last 50 years as national and international demand for cattle, beef and sugar cane ethanol has increased. Already over 10% of the rainforest in this vast region has been converted to cattle pasture and agriculture.
When forests are removed, new vegetation generally has fewer leaves and shallower roots, using less water than the forest it replaces. Consequently, less water evaporates from the land surface and returns to the atmosphere. More water runs off the land instead, increasing stream flow.
The magnitude of change depends on local conditions including rainfall amounts, topography, soils and post-deforestation land use. Studies show little effect when less than 20% of a basin is deforested, but large increases occur when 50 to 100% of a basin loses its forest cover. While these changes occur locally, rivers of all sizes are affected when deforestation is extensive.
Afforestation
Planting new forests has the opposite effect to deforestation, making it a valuable flood prevention measure. Increased vegetation cover enhances interception and infiltration while adding water demand through transpiration. This combination slows water movement to rivers and reduces overall discharge, creating more subdued hydrographs.
Agriculture
Agricultural practices have varied effects on water flow, depending on specific techniques employed:
-
Ploughing breaks up topsoil, initially allowing greater infiltration and creating subdued hydrographs. However, ploughing wet soils can cause impermeable layers called plough pans to form in the subsoil, which inhibit percolation and produce greater surface flows
-
Terracing on hillsides stops water movement downslope, subduing hydrographs
-
Contour ploughing, where furrows run directly down slope, can create small stream channels that lead to flashier hydrographs
-
Grass crops increase infiltration, subduing hydrographs
-
Large numbers of animals grazing in small areas can compact soils, leading to increased overland flows and flashier responses
Urbanisation
The growth of urban areas and other impermeable surfaces such as roads produces flashy rivers. This effect is significantly exacerbated when settlements are built on floodplains, as has commonly occurred throughout human history.
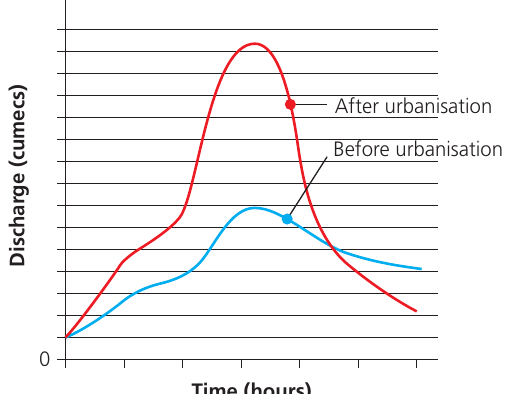
Urban growth expands built-up, impermeable surfaces including roads, pavements, car parks and shopping centres. Most settlements are specifically designed to transfer water as quickly as possible away from human activity to the nearest river. This is achieved through road camber (sloped surfaces), building design and extensive drainage systems.
According to a Royal Horticultural Society report from 2016, London had lost half of all its front gardens to paving, an increase of 36% over ten years. Such widespread replacement of permeable surfaces with impermeable materials dramatically alters the hydrological response.
Urban areas create much shorter lag times, steeper rising and falling limbs, and higher peak discharge compared to rural areas. The dense network of smooth drainage channels means water reaches rivers very quickly, and the river channel itself may be modified to accommodate rapid water removal from the urban area.
Some soft engineering flood management schemes attempt to reduce flashiness in urbanised catchments. Afforestation increases interception and infiltration, slowing the progress of water to river channels and subduing discharge patterns. Water abstraction for domestic and industrial use reduces base flow, meaning more water must accumulate before the channel reaches bankfull capacity.
Key Points to Remember:
-
Discharge is the volume of water passing a point in a river per unit time, measured in cumecs (m³/s), and is calculated by multiplying channel cross-sectional area by water velocity
-
River regimes show seasonal patterns of discharge throughout the year, shaped by climate, geology and basin characteristics. UK rivers typically show late summer/autumn minimums due to high evapotranspiration losses
-
Storm hydrographs illustrate how rivers respond to individual rainfall events. Flashy hydrographs (short lag time, high peak) indicate rapid response, while subdued hydrographs (long lag time, low peak) indicate slower response
-
Physical factors creating flashy hydrographs include: circular basin shape, steep slopes, high drainage density, impermeable rocks/soils, sparse vegetation, intense rainfall, and small basin size
-
Human activities significantly alter natural hydrological responses. Deforestation and urbanisation create flashier hydrographs and increase flood risk, while afforestation and some agricultural practices can subdue hydrographs and reduce flooding