Principles of the use of stellar spectral classes (AQA A-Level Physics): Revision Notes
📚 Revision Notes
9.2.4 Principles of the use of stellar spectral classes
Stellar Spectral Classes
- Stars can be categorised into spectral classes based on their temperature and the strength of absorption lines in their spectra.
- Absorption lines are specific wavelengths of light that are absorbed by elements in a star's atmosphere. The appearance and intensity of these lines depend on the temperature of the star, as the energy of particles within the star varies with temperature.
- Each spectral class has distinctive absorption lines, often associated with the presence of certain elements or molecules.
Hydrogen Balmer Lines
- Balmer lines refer to specific absorption lines from hydrogen that are visible in the spectra of certain stars, especially those in O, B, and A classes.
- These lines are caused by hydrogen atoms absorbing photons, which excites electrons from the n = 2 energy level to higher energy levels.
- If the temperature is too high: Most hydrogen atoms become over-excited or even ionised, meaning electrons are no longer in the n = 2 level. Consequently, Balmer lines are weak or absent.
- If the temperature is too low: Hydrogen atoms lack the energy to become excited, so Balmer lines are also weak or absent.
- Optimal temperature (around 7,500 - 11,000 K): Stars in this range, like A-type stars, exhibit strong Balmer lines because hydrogen atoms are neither overly excited nor too low in energy, allowing electrons to occupy the n = 2 level. This means that the intensity of hydrogen Balmer lines varies according to the temperature of the star, making them a useful indicator of stellar temperature.
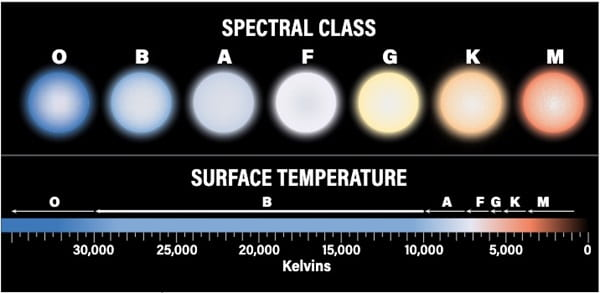
Spectral Classes Table
| Spectral Class | Colour | Temperature Range (K) | Prominent Absorption Lines | Prominence of Hydrogen Balmer Lines |
|---|---|---|---|---|
| O | Blue | 25,000 • 50,000 | He, He, H | Weak |
| B | Blue | 11,000 • 25,000 | He, H | Slightly stronger than O |
| A | Blue/White | 7,500 • 11,000 | H, ionised metals | Strongest |
| F | White | 6,000 • 7,500 | Ionised metals | Weak |
| G | Yellow/White | 5,000 • 6,000 | Ionised and neutral metals | None |
| K | Orange | 3,500 • 5,000 | Neutral metals | None |
| M | Red | < 3,500 | Neutral atoms, Titanium Oxide | None |
- Class O: The hottest stars, emitting blue light with temperatures between 25,000 and 50,000 K. Their spectra show lines of ionised helium (), neutral helium (), and hydrogen ().Balmer lines are weak in this class due to high temperatures ionising hydrogen atoms.
- Class B: Blue stars with temperatures from 11,000 to 25,000 K. They show lines of neutral helium and hydrogen. Balmer lines are slightly stronger than in O-type stars.
- Class A: These are blue-white stars with temperatures between 7,500 and 11,000 K. This class shows strong hydrogen Balmer lines because hydrogen atoms are excited to the right level, making A-type stars particularly useful for studying hydrogen lines.
- Class F: White stars with temperatures between 6,000 and 7,500 K, featuring ionised metal lines. Balmer lines are weak here due to the lower energy levels of hydrogen atoms.
- Class G: Yellow-white stars with temperatures of 5,000 to 6,000 K, showing ionised and neutral metal lines. Balmer lines are not present as the temperature is too low for hydrogen excitation.
- Class K: Orange stars with temperatures between 3,500 and 5,000 K, with neutral metal lines. No Balmer lines are visible due to insufficient energy to excite hydrogen atoms.
- Class M: The coolest stars, red in colour with temperatures below 3,500 K. Their spectra contain neutral atoms and titanium oxide (TiO) lines. Hydrogen Balmer lines are absent as these temperatures are too low to excite hydrogen atoms.
infoNote
Key Points
- Spectral classification provides valuable information about a star's temperature and chemical composition.
- Hydrogen Balmer lines are an important tool for identifying temperature ranges, especially for hotter stars in classes O, B, and A.
- By examining the prominent absorption lines in a star's spectrum, astronomers can estimate its spectral class and therefore its approximate temperature and colour.