The Hertzsprung-Russell (HR) Diagram (AQA A-Level Physics): Revision Notes
📚 Revision Notes
9.2.5 The Hertzsprung-Russell (HR) Diagram
Hertzsprung-Russell (HR) Diagram
The Hertzsprung-Russell (HR) Diagram is a key tool in astrophysics, providing a graphical representation of stars by plotting their temperature against their absolute magnitude (intrinsic brightness). Understanding this diagram helps in analysing star characteristics and evolutionary stages.
Key Points on the HR Diagram:
- The temperature scale on the HR diagram is logarithmic, meaning it halves at each interval.
- The absolute magnitude scale is also arranged from positive (fainter) at the bottom to negative (brighter) at the top, making brighter stars appear higher on the diagram.
- Spectral classes are categorised from O (hottest) to M (coolest), aligned with the temperature scale.
The Sun's Position on the HR Diagram
- The Sun is a main sequence star with a spectral class G and an absolute magnitude of 4.83.
- Using this information, the Sun can be plotted on the HR diagram within the main sequence band in the G class range.
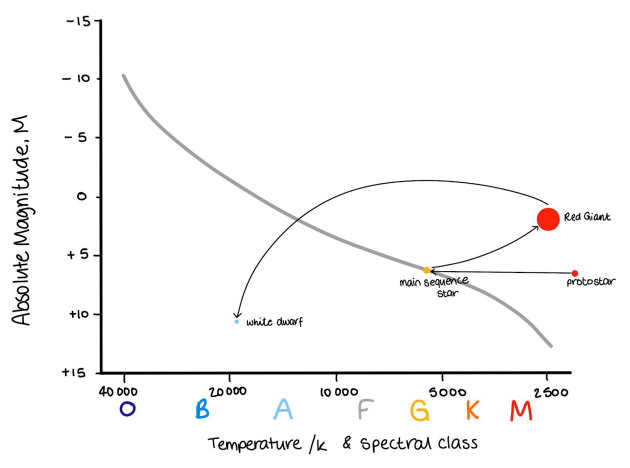
Evolutionary Path of Sun-like Stars on the HR Diagram
- Main Sequence to Red Giant:
- When a main sequence star (like the Sun) exhausts the hydrogen in its core, it moves up and to the right on the HR diagram, becoming a red giant.
- Red giants are cooler and brighter than main sequence stars.
- Red Giant to White Dwarf:
- After burning helium, the red giant will eject its outer layers and collapse into a white dwarf.
- On the HR diagram, this transition moves the star down and to the left, where it is hotter and dimmer than a main sequence star.
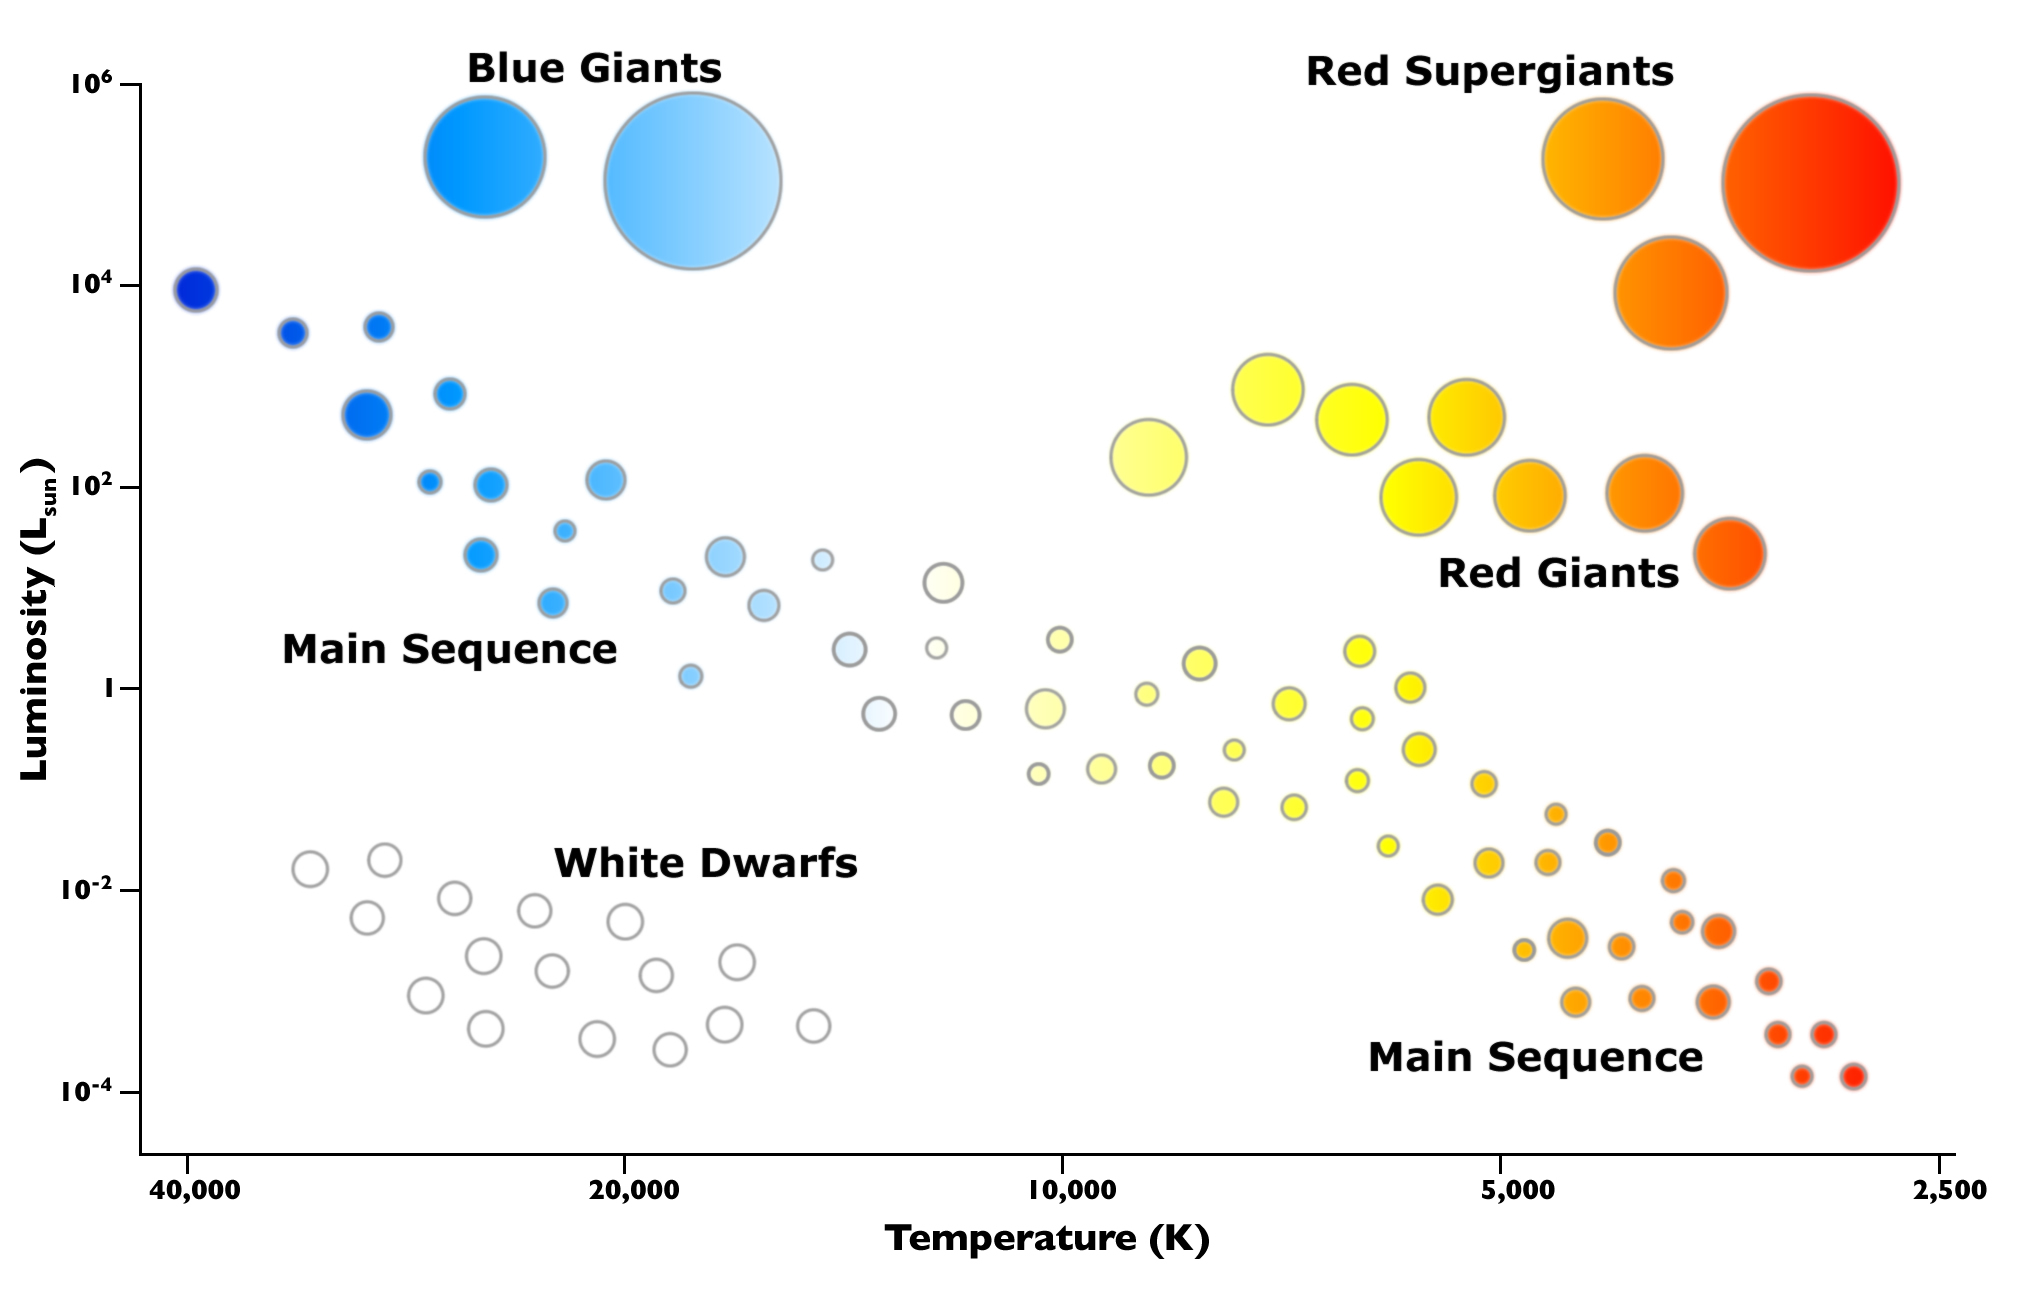
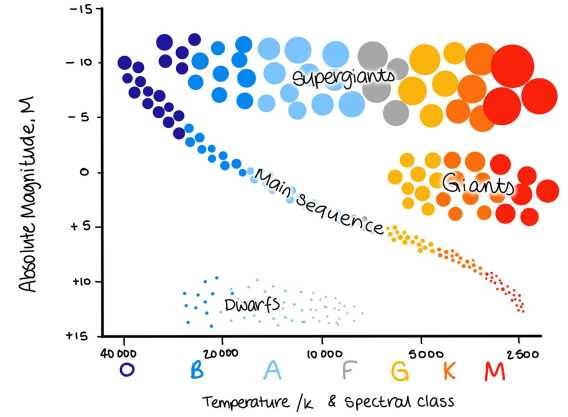
Diagram Interpretation
- The HR diagram typically shows:
- Main Sequence: A diagonal band where most stars, including the Sun, are found, representing hydrogen-burning stars.
- Giants and Supergiants: Large, luminous stars that are cooler, found at the upper-right of the HR diagram.
- White Dwarfs: Hot, small, and faint stars found at the lower-left of the diagram.