The Hertzsprung-Russell (HR) Diagram (AQA A-Level Physics): Revision Notes
The Hertzsprung-Russell (HR) Diagram
Introduction to the HR diagram
The Hertzsprung-Russell diagram (or HR diagram) is a powerful tool in astrophysics that reveals how stars differ and evolve throughout their lifetimes. Named after astronomers Ejnar Hertzsprung and Henry Norris Russell, this diagram plots the relationship between a star's luminosity and its surface temperature.
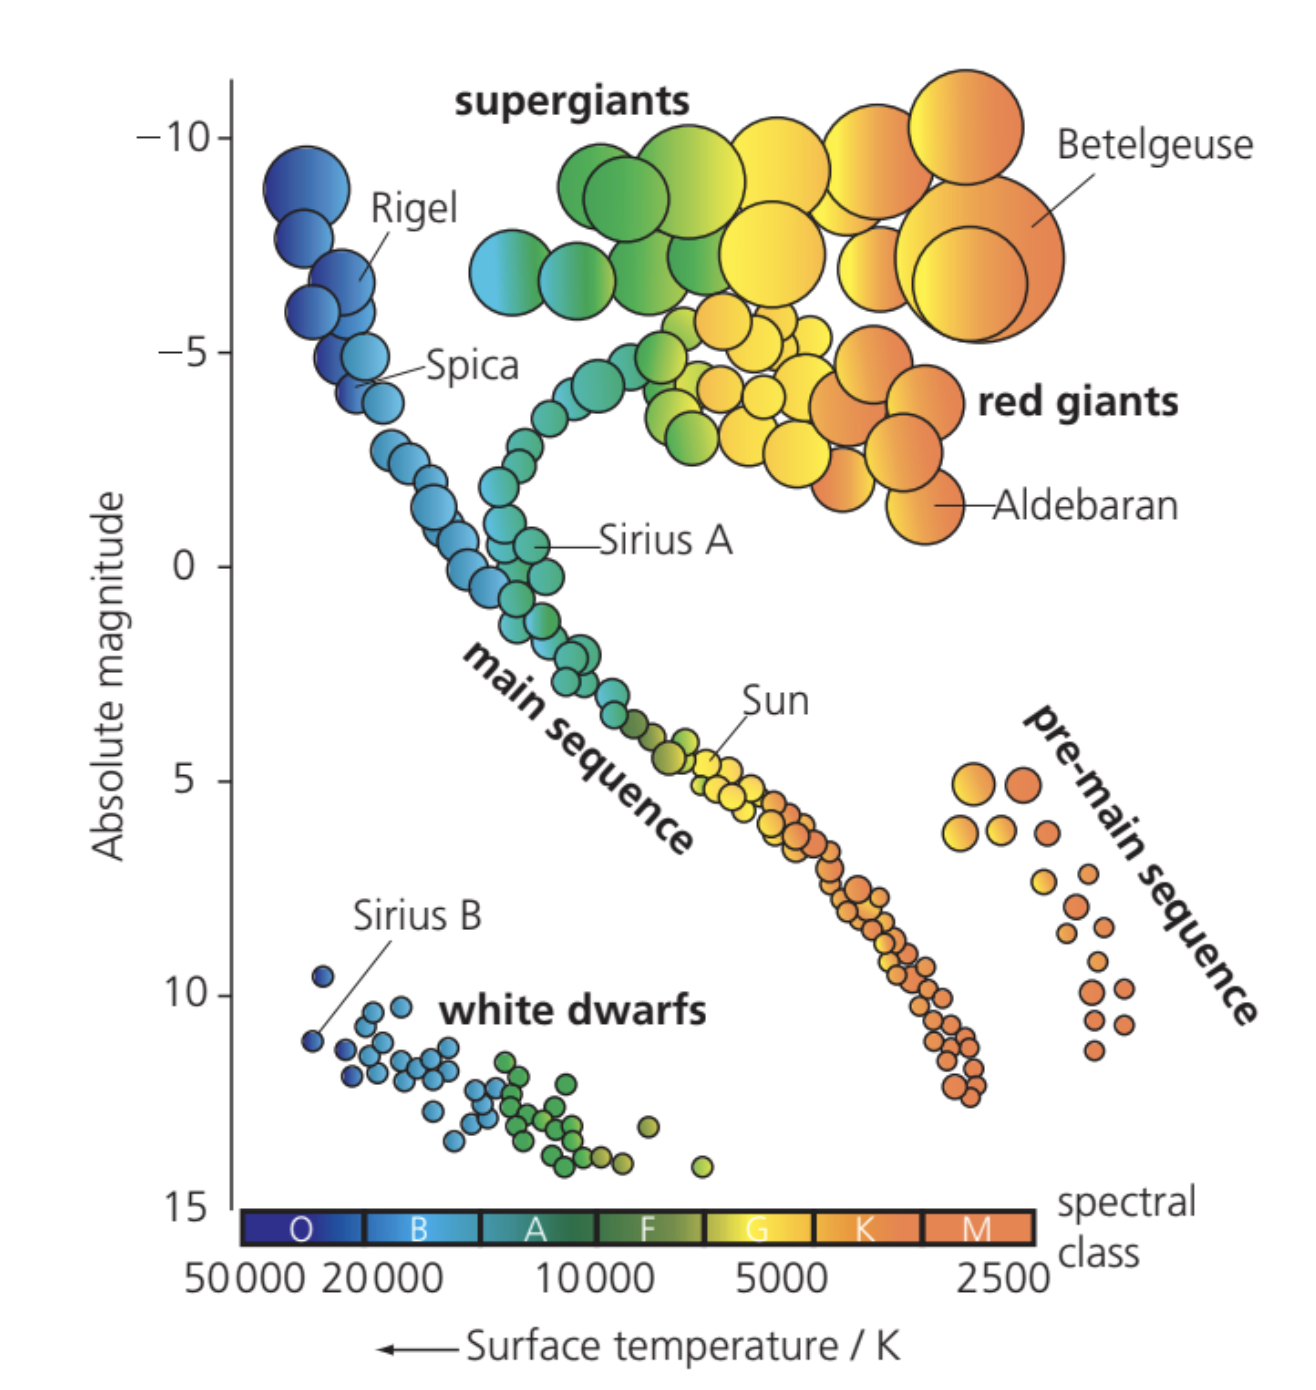
The HR diagram is essentially a graph that shows absolute magnitude (a measure of a star's actual luminosity) on the vertical axis against spectral class (or surface temperature) on the horizontal axis. Spectral classes range from O to M in order of decreasing temperature.
When we plot these properties for all observable stars, we discover something remarkable: stars are not randomly scattered across the diagram. Instead, they cluster into distinct groups, each representing different stages of stellar evolution.
The four principal groupings on the HR diagram
Stars on the HR diagram fall into four main categories, each with distinct physical properties:
Main sequence stars
The main sequence is a long diagonal band running from the top left (hot and luminous) to the bottom right (cool and dim) of the HR diagram. This is where stars spend most of their lives - roughly 90% of observable stars are found here.
Main sequence stars share important characteristics:
- They are stable and long-lived
- Nuclear fusion of hydrogen into helium is their dominant energy source
- Their position on the main sequence is determined by their mass
At the top of the main sequence are hot, luminous blue stars (spectral classes O and B). At the bottom are cool, dim reddish stars (spectral class M). Our Sun is a main-sequence star of average mass and luminosity, classified as spectral class G, positioned roughly halfway along the sequence.
Red giants
Red giants are stars with masses similar to our Sun but have undergone expansion. They possess:
- An expanded outer shell, giving them large size and surface area
- Cooler surface temperatures (hence appearing red)
- High luminosity despite their lower temperature
- Nuclear fusion of helium occurring in their cores
Red giants appear in the upper right portion of the HR diagram, indicating high luminosity but relatively low temperature.
Supergiants
Supergiants represent the most massive and luminous stars. Their properties include:
- Masses typically 10-100 times that of the Sun
- Substantially larger size and higher luminosity than red giants
- Core temperatures hot enough for nuclear fusion to produce carbon and heavier elements
Supergiants occupy the uppermost region of the HR diagram.
White dwarfs
White dwarfs are old stars that have reached the end of their nuclear burning phase:
- High surface temperature but low luminosity
- No longer generate energy through nuclear fusion
- Extremely small size (roughly planet-sized)
- Extremely high density ( to kgm)
A teaspoonful of white dwarf matter would weigh several tonnes on Earth! White dwarfs appear in the bottom left corner of the HR diagram - hot but not luminous because of their small size.
Eventually, white dwarfs cool to the point of emitting no heat or light, becoming black dwarfs - the apparent end state of all low-mass stars.
The significance of the HR diagram
The HR diagram reveals that fundamentally different kinds of stars exist. 'Normal stars' like the Sun lie along the main sequence, while 'unusual stars' such as giants and white dwarfs show a very different relationship between luminosity and temperature.
Most importantly, the HR diagram allows us to understand stellar evolution - how stars are born, age, and die. By examining where a star sits on the diagram, we can infer its current evolutionary stage and predict its future.
Evolution of a Sun-like star on the HR diagram
The evolutionary life cycle of a star can be tracked on the HR diagram, with its fate depending on its mass at various stages.
For an average star like the Sun, the evolutionary path follows these stages:
From protostar to main sequence
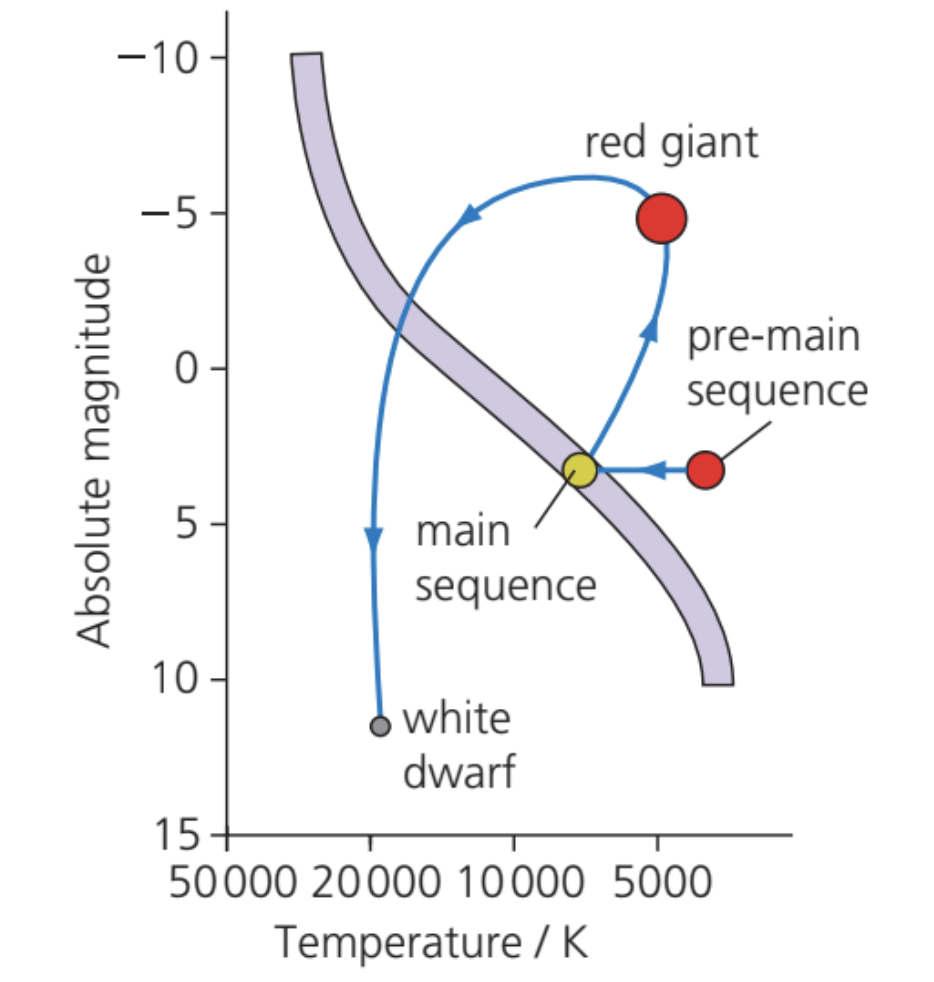
A star begins as a protostar forming in an interstellar gas cloud. As nuclear fusion reactions begin in its core, it becomes a pre-main-sequence star, appearing in the upper right portion of the HR diagram.
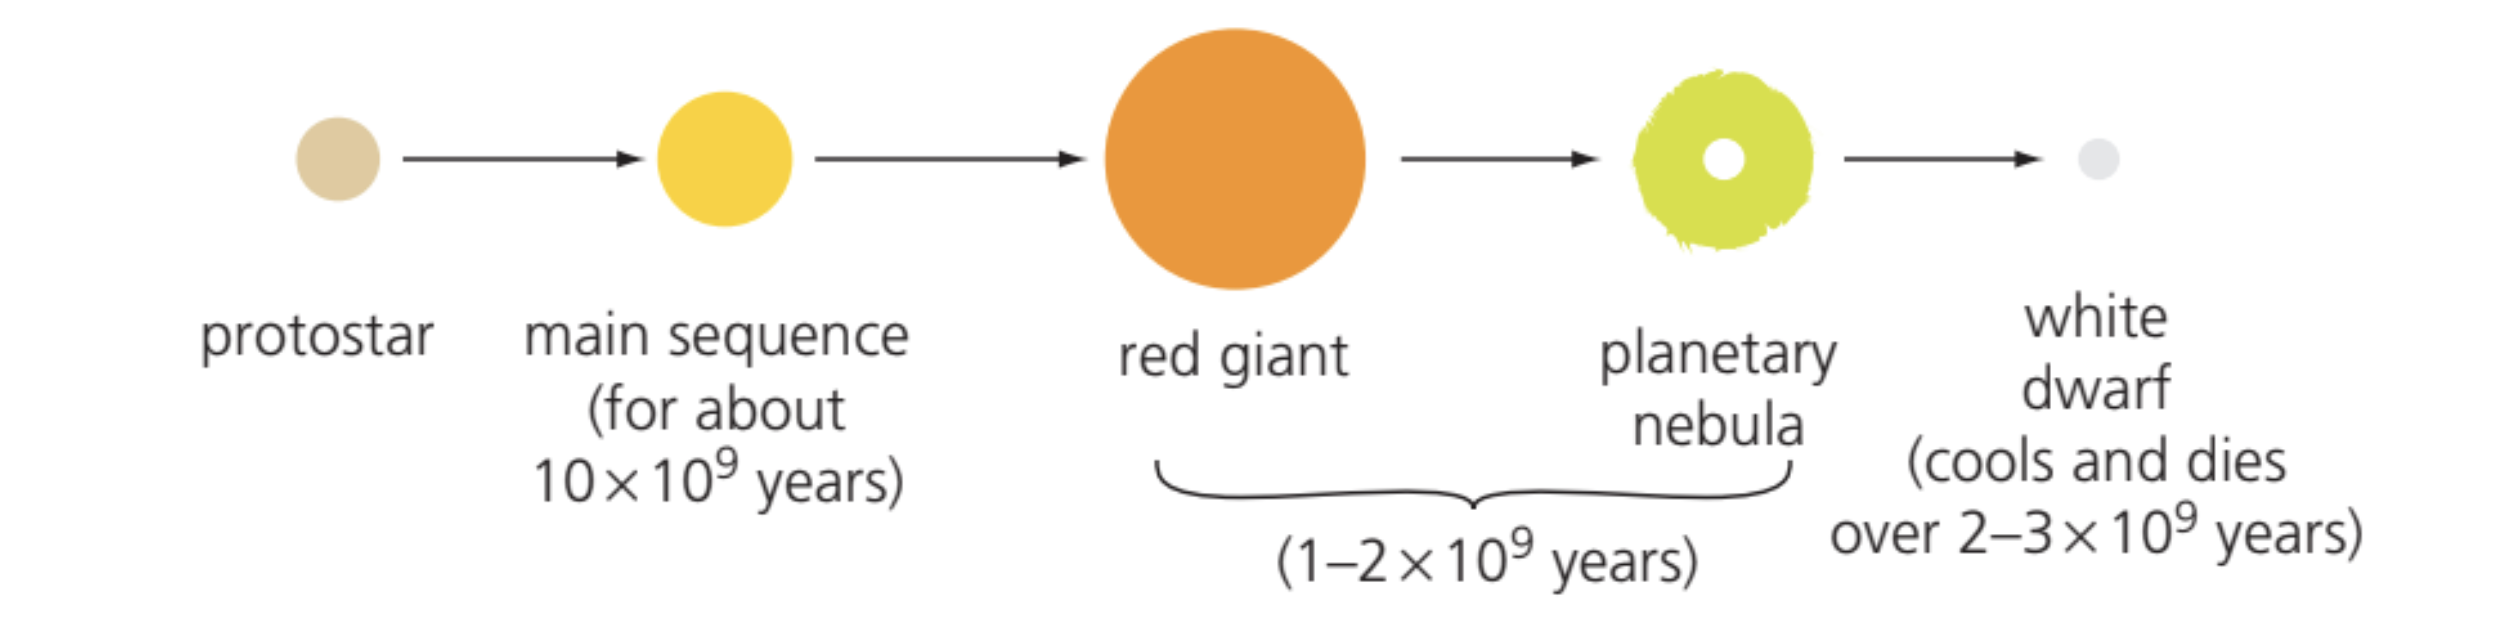
The pre-main-sequence star then moves toward the main sequence, settling at a position along the diagonal line (from top left to bottom right) determined by its mass. The star remains at this position on the main sequence for most of its life - for a star of one solar mass, this is approximately 10 billion years.
The main sequence phase
During this long, stable phase, the star fuses hydrogen into helium in its core. The star maintains equilibrium between the outward pressure from fusion reactions and the inward pull of gravity. For the Sun, this phase lasts about years. It is currently about years old, meaning it is roughly halfway through its main sequence lifetime.
Red giant phase
When the hydrogen in the core is exhausted, the star begins burning hydrogen in its outer layers. This causes the star to expand greatly into a red giant, with:
- Much larger size
- Lower surface temperature
- Higher overall luminosity
On the HR diagram, the star moves off the main sequence toward the upper right corner. This red giant phase lasts approximately years.
Planetary nebula and white dwarf
Eventually, when all nuclear fuel is exhausted, the red giant ejects its outer layers, forming a planetary nebula - a beautiful shell of gas expanding into space. The core that remains collapses into a dense white dwarf.
The white dwarf initially remains very hot, positioning it in the bottom left corner of the HR diagram. However, since nuclear burning has ceased, there is no outward pressure to oppose gravity. The core compresses to roughly Earth-sized dimensions, with matter reaching densities of to kgm.
Further collapse is prevented by degeneracy pressure - an outward pressure arising from the Pauli exclusion principle (a quantum mechanical rule stating that no two particles can occupy exactly the same quantum state simultaneously). At the extreme densities in a white dwarf, electrons are prevented from occupying the same space, creating this pressure that opposes gravitational contraction.
Black dwarf - the final stage
The white dwarf gradually cools over years, eventually becoming a black dwarf that emits no significant heat or light. This represents the end state for low-mass stars like the Sun.
Understanding stellar lifetimes
The lifetime of a star on the main sequence is determined primarily by its mass. This relationship arises because more massive stars have higher core temperatures and pressures, causing fusion reactions to proceed much faster.
Mass determines burning rate
In more massive stars, fusion reactions occur at a faster rate than in lower mass stars. As a result, they consume their hydrogen fuel more rapidly and spend shorter times on the main sequence before evolving into red giants.
Conversely, lower mass stars burn their fuel slowly and can remain on the main sequence for extremely long periods - far longer than the current age of the Universe (approximately years).
Main sequence lifetimes for different spectral classes
| Mass (solar masses) | Spectral class | Main-sequence lifetime (million years) |
|---|---|---|
| 25 | O | 3 |
| 15 | B | 15 |
| 3 | A | 500 |
| 1.5 | F | 3000 |
| 1.0 | G | 10,000 |
| 0.75 | K | 15,000 |
| 0.50 | M | >200,000 |
This table clearly shows the inverse relationship between mass and lifetime. The most massive O-type stars live only about 3 million years, while the least massive M-type stars can survive for over 200 billion years.
Implications for stellar populations
Stars higher along the main sequence than the Sun (spectral classes O to F) must be younger than the Sun, or they would have already exhausted their core hydrogen and moved off the main sequence.
At the other extreme, every M-type star in existence is still on the main sequence because their lifetimes exceed the age of the Universe. These low-mass, low-temperature, low-luminosity stars are called red dwarfs - they are the oldest stars in the Universe. They burn through their hydrogen supply so slowly that they have extremely long lifetimes, well in excess of Sun-like stars and longer than the Universe has existed.
Important clarifications
The HR diagram is a 'snapshot' of a collection of different types of stars at various stages of their evolution. An important point to understand is that stars do not move along the main sequence.
Instead, when a star forms and reaches the main sequence as a pre-main-sequence star, it settles at a specific point on the main sequence determined by its mass, and it stays there throughout its main sequence phase. Only later, when nearing the end of its life and exhausting its core hydrogen, does it move off the main sequence to evolve into a different type of star (red giant, then white dwarf for low-mass stars).
Remember!
Key Points to Remember:
-
The HR diagram plots absolute magnitude (luminosity) against spectral class (temperature), revealing that stars cluster into four distinct groups: main sequence, red giants, supergiants, and white dwarfs.
-
Stars spend approximately 90% of their lives on the main sequence, fusing hydrogen into helium in a stable equilibrium state.
-
A star's mass determines its lifetime on the main sequence - more massive stars (O and B types) live only millions of years, while less massive stars (M types) can survive for hundreds of billions of years.
-
Sun-like stars evolve from protostar → main sequence (10 billion years) → red giant (1-2 billion years) → white dwarf → black dwarf, with each stage occupying a different position on the HR diagram.
-
White dwarfs are prevented from collapsing further by degeneracy pressure arising from quantum mechanical effects, reaching extreme densities of to kgm despite being only Earth-sized.