Decision Trees (Edexcel A-Level Business): Revision Notes
Decision Trees
What are decision trees?
Decision trees are a quantitative technique used by businesses to evaluate alternative courses of action when faced with uncertain outcomes. They provide a visual method of mapping out different decisions, showing the possible results and their likelihood of occurring.
Businesses face risk when making decisions because they often have limited information and uncertain outcomes. For example, launching a new product in an unfamiliar market carries risk because the firm cannot predict consumer reactions with certainty. Decision trees help businesses to identify the option that offers the greatest expected return while minimising risk.
The technique works by assigning numerical values to different outcomes and their probabilities. This quantitative approach allows businesses to compare options objectively. The diagram resembles a tree with branches, showing different pathways a business might take and where key decisions must be made.
Features of decision trees
Decision trees contain several key components that work together to model business decisions:
Decision points are represented by squares in a decision tree. These show points where the business must actively choose between different courses of action. For example, a business might need to decide whether to launch a new advertising campaign or retain an existing one. At each decision point, the business controls which path to follow.
Chance nodes (also called outcomes) are represented by circles. These show points where different outcomes might occur based on factors outside the business's control. Each chance node branches into the possible results of a decision, such as success or failure of a new product launch.
Probability values indicate the likelihood of each outcome occurring. Probabilities are expressed as decimal numbers between 0 and 1, where 0 means the outcome is impossible and 1 means it is certain. For example, a probability of 0.2 means there is a 20% chance of that outcome occurring, while 0.8 indicates an 80% chance. All probabilities from a single chance node must add up to 1.
Businesses can estimate probabilities using two main sources of information:
- Backdata refers to historical information from past events - if a business has opened 10 stores and 9 were successful, the probability of future success might be estimated as 0.9
- Research data comes from market research, surveys or studies conducted to predict how customers or markets will respond to decisions
Expected monetary values (EMV) represent the financial outcome of each decision. The EMV is calculated by multiplying the profit or loss of each outcome by its probability. This allows businesses to determine which decision offers the best financial return when uncertainty is taken into account.
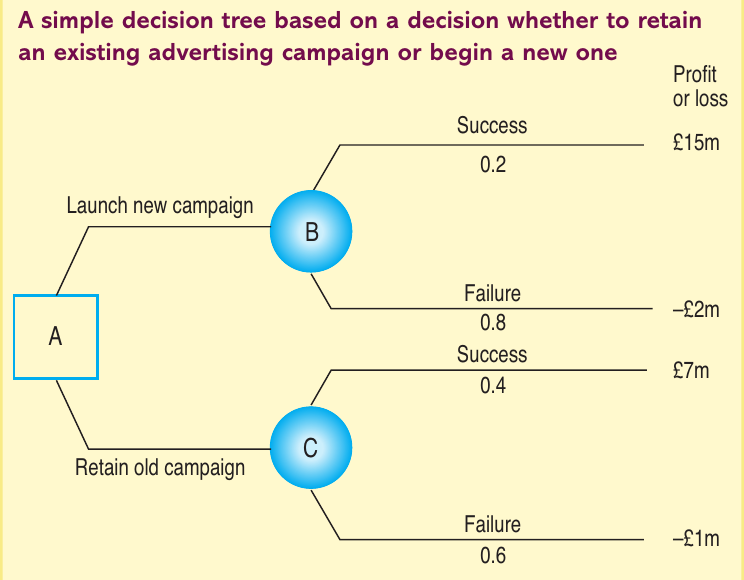
The diagram above shows a simple decision tree for an advertising campaign decision. Square A is the decision point where the business chooses between launching a new campaign or retaining the old one. Circles B and C are chance nodes showing the possible outcomes (success or failure) with their probabilities and associated profits or losses.
Calculating expected monetary values
The expected monetary value (EMV) is calculated using the formula:
Where represents probability and represents outcome.
For each possible outcome, multiply its probability by the financial result, then add all these values together. This gives you the weighted average outcome for that decision.
Worked Example: Simple Decision Tree Calculation
Using the advertising campaign example, let's calculate the EMV for launching a new campaign:
- Success: probability 0.2, profit $15m
- Failure: probability 0.8, loss $2m
Multiple outcomes:
Decision trees can handle more than two outcomes at a chance node. When there are three or more possible results, the same calculation method applies - multiply each outcome by its probability and sum all the results.
Worked Example: Decision Tree with Multiple Outcomes
If a new campaign had three possible outcomes:
- Great success: probability 0.2, profit $15m
- Average success: probability 0.4, profit $6m
- Failure: probability 0.4, loss $2m
Working with complex decision trees
Real business decisions often involve multiple stages and sequential choices. The rollback technique is used to solve complex decision trees by working backwards from right to left, calculating expected values at each node.
Multi-stage decision example:
Consider a farmer who inherits land and faces three options:
- Sell immediately for $0.6m (certain outcome)
- Wait one year for market conditions to improve
- Seek planning permission to develop the land

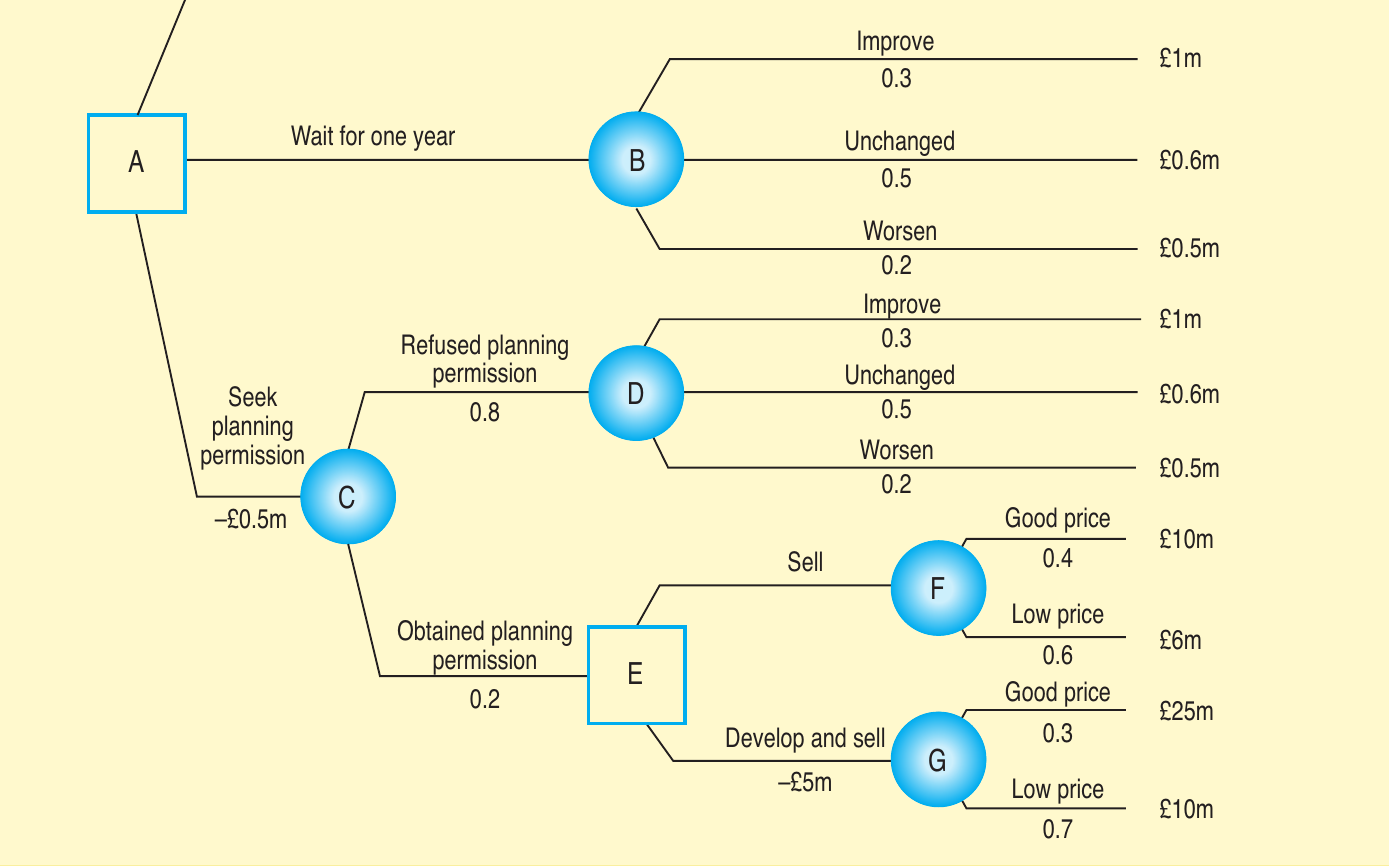
The decision tree above shows a complex scenario involving multiple decision points and chance nodes. The farmer must first decide at node A, then potentially face further decisions at node E if planning permission is obtained.
To solve complex decision trees, we use the rollback technique: work backwards from right to left, calculating expected values at each node and making optimal decisions along the way.
Worked Example: Multi-Stage Decision Tree Using Rollback Technique
Step 1: Calculate EMV at the rightmost chance nodes
At node B (wait one year):
At node D (refused planning permission):
At node F (sell undeveloped):
At node G (develop then sell):
Step 2: Make decisions at decision nodes
At node E, the farmer chooses between:
- Selling: $7.6m
- Developing: $14.5m - $5m cost = $9.5m
The develop option is better, so we cross out the sell branch and use $9.5m.
Step 3: Continue rolling back
At node C (planning permission outcomes):
\text{EMV} & = & (0.2 \times £9.5m) + (0.8 \times £0.7m) \\ & = & £1.9m + £0.56m \\ & = & £2.46m \end{array}$$ Subtract the planning permission cost: $£2.46m - £0.5m = £1.96m$ **Step 4: Make final decision at node A** Comparing all three options: - Sell immediately: \$0.6m - Wait one year: \$0.7m - Seek planning permission: :success[\$1.96m] **Conclusion:** The optimal decision is to :success[seek planning permission], as it offers the highest expected value.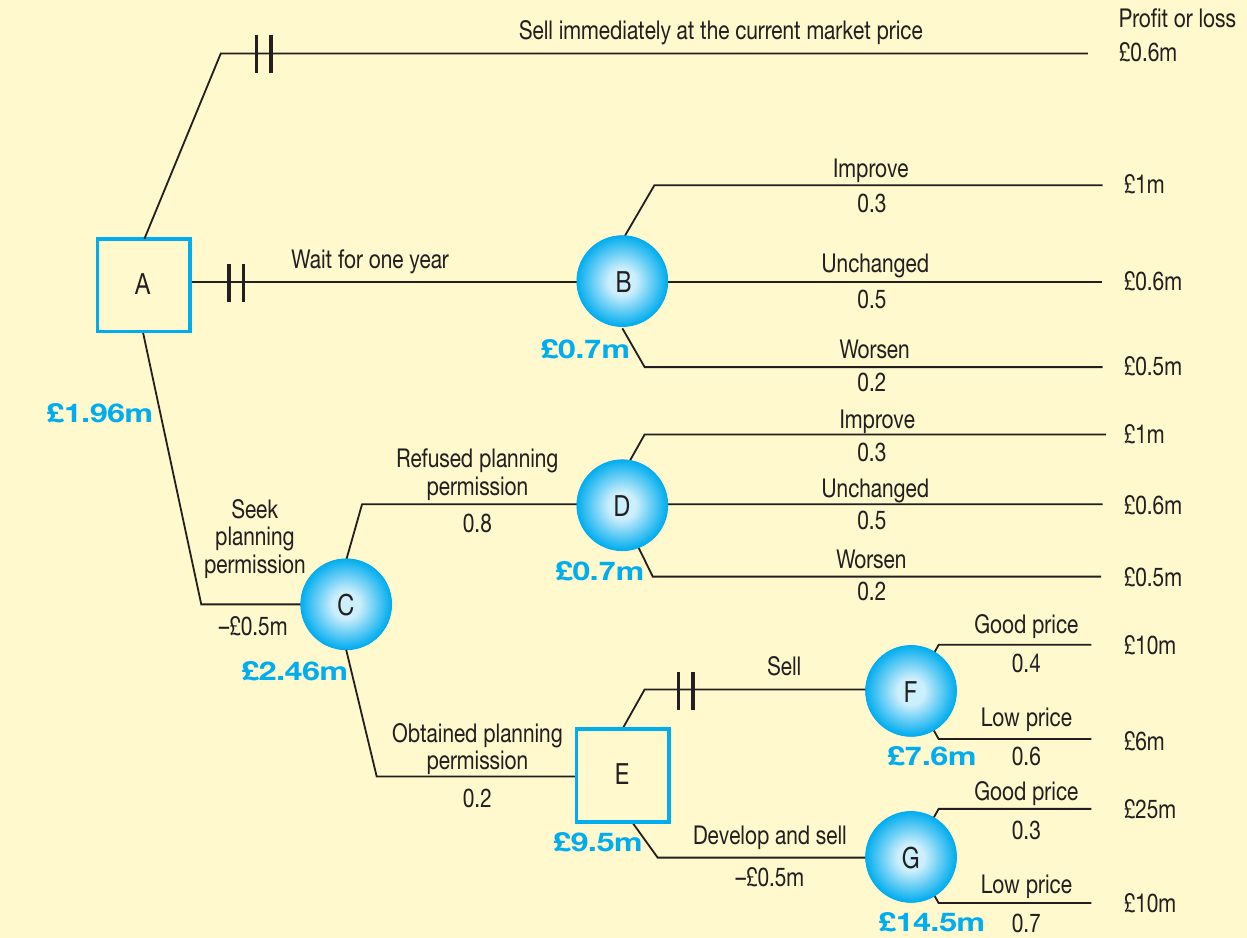
The completed decision tree shows all expected values and indicates which branches should not be taken (marked with //). This visual representation makes it clear which path offers the best financial outcome.
Advantages of decision trees
Decision trees offer several benefits for business decision making:
Identifying new options: The process of constructing a decision tree forces managers to map out all possible courses of action systematically. This structured approach often reveals alternative strategies that had not been previously considered, broadening the range of options available.
Quantitative basis for decisions: By assigning numerical values to outcomes and probabilities, decision trees provide an objective foundation for comparing options. This removes some of the guesswork from decision making and gives managers concrete figures to justify their choices to stakeholders.
Risk assessment and management: Decision trees explicitly show the risks involved in each decision path through probability values. This helps management separate significant risks from minor ones, allowing them to focus attention on the most important uncertainties. The technique makes risk visible and quantifiable rather than leaving it as a vague concern.
The tree diagram provides an easy-to-understand visual representation of complex decisions. Stakeholders can quickly grasp the alternatives, risks and expected outcomes, which aids communication and builds consensus around the chosen strategy.
Limitations of decision trees
Despite their usefulness, decision trees have several significant limitations that businesses must consider:
Uncertainty in probability estimates: The technique relies heavily on probability estimates, which are often subjective judgements rather than precise facts. If these estimates are inaccurate, the entire analysis becomes unreliable. Even when based on historical data or research, probabilities about future events remain uncertain.
Exclusion of qualitative factors: Decision trees focus on quantifiable outcomes like profit and loss, but many important business considerations cannot be reduced to numbers. Employee morale, brand reputation, ethical considerations, legal constraints and stakeholder relationships all influence decisions but are difficult to incorporate into a decision tree. This means the technique may overlook crucial non-financial factors.
Time lags and outdated information: Creating and analysing decision trees can be time-consuming, especially for complex decisions with multiple stages. By the time the analysis is complete and a decision is made, some of the underlying data may have become outdated. Market conditions, competitor actions or economic factors can change rapidly, making the original analysis less relevant.
Potential for bias and manipulation: Managers may consciously or unconsciously manipulate the probabilities and outcomes to favour a preferred course of action. Someone who wants to pursue a particular strategy might assign optimistic probabilities to positive outcomes or pessimistic probabilities to alternatives. This bias distorts the results and undermines the objectivity of the technique.
Static nature vs dynamic business environment: Decision trees represent a snapshot of a situation at one point in time, but business environments are constantly evolving. A sudden change in economic conditions, new competitor entry, technological disruption or regulatory changes can instantly make a decision tree analysis obsolete. The technique struggles to account for the dynamic, unpredictable nature of real business environments.
Resource intensive: Developing comprehensive decision trees requires significant time and effort from managers and analysts. For smaller decisions, this investment of resources may not be worthwhile compared to simpler decision-making methods.
Expected value vs actual outcome: It is crucial to understand that the expected monetary value is not the actual amount of money the business will make. The EMV is simply a tool for comparing options - the actual outcome will be one of the specific values shown at the end of the tree branches, not the calculated expected value.
Key Concepts:
- Decision trees are quantitative tools that map out alternative courses of action and their possible outcomes using diagrams
- They help businesses make decisions under uncertainty by assigning probabilities and financial values to different scenarios
- The technique aims to identify the option with the highest expected monetary value (EMV)
Essential Components:
- Squares = decision points where the business chooses between actions
- Circles = chance nodes where outcomes occur based on probability
- Probabilities = values between 0 and 1 indicating likelihood of outcomes
- EMV = calculated by multiplying each outcome by its probability and summing the results
Key Formula:
For complex trees, use the rollback technique: work from right to left, calculating EMVs at each node
Critical Points to Remember:
- Decision trees provide objectivity and structure but rely on estimated probabilities that may be inaccurate
- They focus on quantifiable outcomes and may overlook important qualitative factors like brand reputation or employee morale
- The EMV is a comparison tool, not the actual profit the business will make - the real outcome will be one of the specific branch values