Indicators of Development (Edexcel A-Level Economics A): Revision Notes
Indicators of Development
Introduction to measuring development
Development is a broader concept than economic growth alone. While economic growth focuses on increasing the resources available to a society, development encompasses how those resources are used to improve people's quality of life. Understanding development requires us to examine multiple dimensions of human well-being.
Development refers to the process by which real per capita incomes increase and the inhabitants of a country benefit from improved living conditions. This includes lower poverty levels and enhanced standards of education, health, nutrition, and other essentials of life.
Some countries have successfully closed the gap with developed nations. The tiger economies of South East Asia (Hong Kong, South Korea, Singapore, and Taiwan) achieved rapid economic growth from the 1960s onwards. More recently, emerging economies including the BRICS countries (Brazil, Russia, India, China, and South Africa) have experienced significant progress. However, other developing countries, particularly in sub-Saharan Africa, have made relatively little progress.
Measuring development with GNI per capita
An obvious starting point for measuring development is Gross National Income (GNI) per capita. However, using this measure for international comparisons presents challenges. To make meaningful comparisons, GNI per capita is typically measured using Purchasing Power Parity (PPP), which adjusts for differences in price levels between countries.
While GNI per capita provides useful information about average income levels, it has significant limitations. It reveals the gap in income between countries but fails to capture other important dimensions of development that need consideration.
The Human Development Index
To address the criticism that GNI per capita fails to account for other dimensions of quality of life, the United Nations Development Programme (UNDP) devised an alternative indicator in 1990. The Human Development Index (HDI) is a composite indicator of a country's level of development, with values ranging between 0 and 1. Higher values reflect higher human development.
Components of HDI
The HDI recognises three key aspects of human development: a decent standard of living (resources), knowledge of how to make good use of those resources (education), and a long and healthy life in which to make use of those resources (health).
These three components are measured as follows:
- Decent standard of living: Measured by GNI per capita in PPP
- Knowledge: Measured by indicators of education (mean years of schooling and expected years of schooling)
- Long and healthy life: Measured by life expectancy at birth
The measurements are combined to produce a composite index ranging between 0 and 1, with higher values indicating higher human development.
Understanding education indicators
Education is represented by two different variables in the HDI, each capturing important but contrasting aspects:
Mean years of schooling: This is an output measure that tells us about the effectiveness of past education. It reflects the average number of years of schooling that adults aged 25 or above have received. This measures what the education system has already achieved.
Expected years of schooling: This is an input measure that indicates how many years of schooling a child entering education can expect to receive. This measures the current capacity and reach of the education system.
HDI data analysis
The following chart shows HDI values for selected countries in 2021:
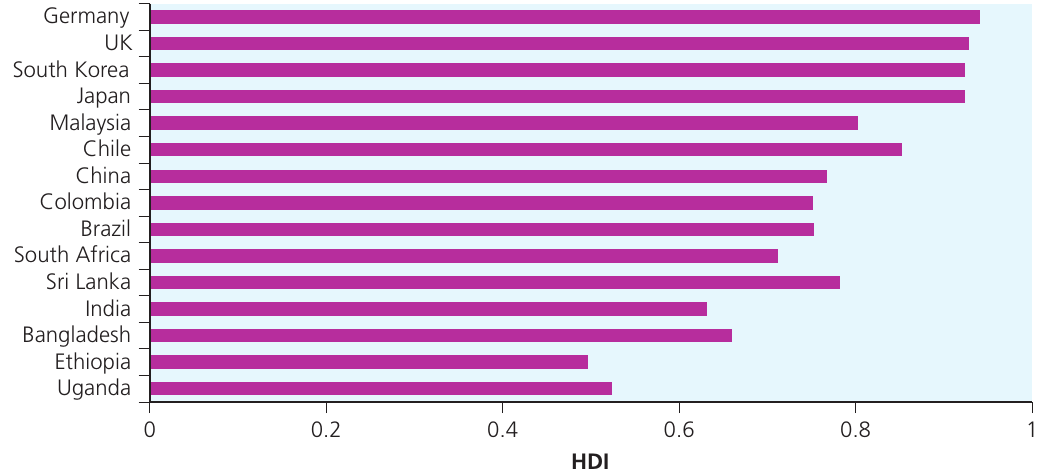
Countries remain ranked in descending order of GNI per capita, but the gap between low and high human development is less pronounced than when looking at income alone. Some interesting patterns emerge from the data. South Africa and Malaysia, for example, rank lower on the HDI than on GNI per capita, suggesting these countries show lower levels of human development than their income performance would indicate. Conversely, countries like Chile and Sri Lanka perform better on HDI grounds than on GNI per capita.
The level of HDI fell in many countries during 2020 and 2021, reflecting the pressures created by the COVID-19 pandemic.
Life expectancy patterns
Life expectancy at birth provides insights into health standards and healthcare provision across countries:
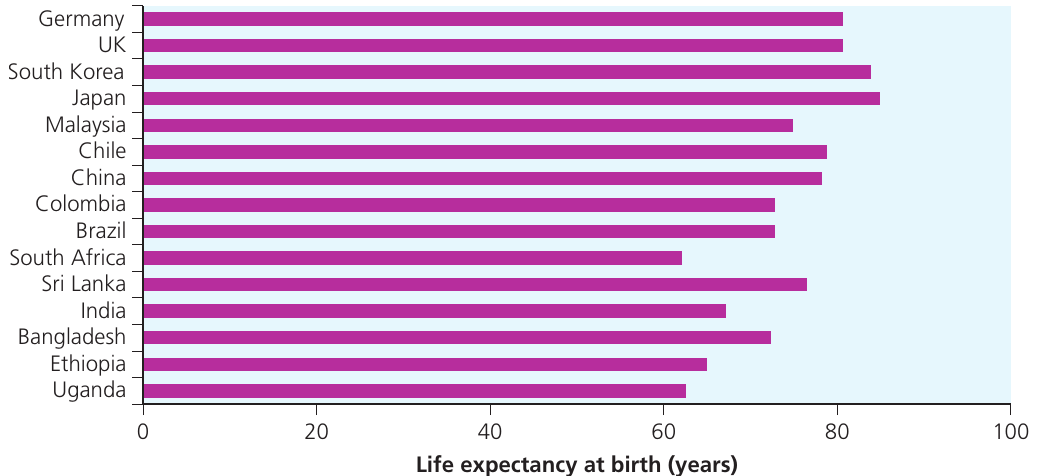
Life expectancy is primarily responsible for the low ranking of South Africa in the HDI. South Africa's level of life expectancy is significantly below what would be expected given its average income level and mean years of schooling. In contrast, Bangladesh performs relatively well in terms of lifespan but poorly in terms of education. These comparisons illustrate the diversity between countries that was mentioned earlier.
Education and schooling
Mean years of schooling vary considerably across countries:
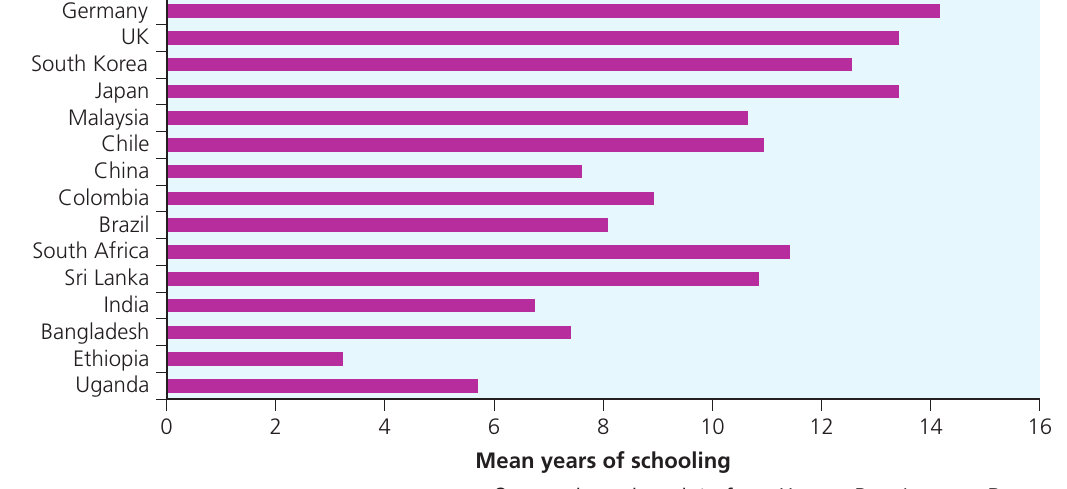
The diversity in education levels reflects differing priorities that governments have given to various aspects of development. Countries such as Brazil have aimed primarily at achieving economic growth, while countries like Sri Lanka have given greater priority to promoting education and healthcare.
Study tip: Do not attempt to memorise detailed statistics about individual countries. Focus instead on understanding the general differences in the stage of development reached by countries in different regions. Being aware of broad patterns is helpful, but memorising specific data is unnecessary.
Growth vs development
There is a view that growth should be the prime objective for development. By expanding the resources available, the benefits can begin to trickle down through the population. An opposing view claims that by providing first for basic needs, more rapid economic growth can be facilitated.
The problem in some cases is that growth has not resulted in the trickle-down effect, and inequality remains. It may be significant that countries such as Brazil and South Africa, where the GNI per capita ranking is high relative to the HDI ranking, are countries in which there remain high levels of inequality in the distribution of income.
The HDI may be preferred to GNI per capita as a measure of development because it reflects the key dimensions of development as opposed to growth alone. However, it will always be difficult to reduce a complex concept such as development to a single statistic. The diverse characteristics of developing countries demand the use of a range of alternative measures to identify the specific configuration of circumstances and problems facing a particular country.
In the area of healthcare, examining the number of doctors relative to population or levels of infant mortality provides useful insights. For infrastructure, access to improved water, sanitation, or electricity is informative, as is access to a mobile phone.
Other indicators of development
Although the HDI is a useful composite indicator that is more informative about relative living standards across countries, it still neglects some important dimensions of development. The UNDP has recognised this and has produced a number of other indicators designed to complement the HDI, notably in respect of inequality, gender, and poverty.
The Inequality-adjusted HDI
Inequality in the three components of the HDI (health, education, and standard of living) is used to adjust the HDI to estimate the extent to which potential human development is lower because of inequalities. For example, South Africa experiences relatively high inequality.
Worked Example: Understanding the Inequality-adjusted HDI
In terms of the Inequality-adjusted HDI (IHDI), the conclusion drawn is that the loss in potential human development due to inequality in South Africa amounts to 34%.
This means that when inequality is factored in, South Africa's human development is significantly lower than the standard HDI suggests. If South Africa's standard HDI is 0.713, the IHDI would be approximately .
Gender inequality
The situation of women in many countries has been a major concern. Women tend to receive less education, are exposed to greater health risks, and receive lower incomes. The UNDP has produced two ways of exploring gender inequality across countries.
One approach calculates the HDI separately for females and males. In more developed countries, female life expectancy is often significantly higher than for males, so the difference in HDI levels between females and males is not great, even where females face lower GNI per capita. Indeed, some countries (such as Estonia) show females having a higher HDI than males.
However, the picture is very different elsewhere. For example, in Pakistan, female HDI is about 25% lower than for males. A second measure focuses on the key gender issues of health, empowerment, and the labour force, providing a more targeted assessment of gender-specific challenges.
The Multidimensional Poverty Index
In previous discussions, poverty was examined in relation to income or consumption levels. However, poverty is not just about income; it is also about deprivation—lack of access to key resources.
The Multidimensional Poverty Index (MPI) attempts to reflect the number of deprivations faced by households. These deprivations are grouped into the three key components of the HDI (health, education, and standard of living). They include:
- School attainment and attendance (for education)
- Nutrition and child mortality (for health)
- Lack of access to a range of things such as: electricity, clean water, sanitation, good cooking fuels, a floor that is not dirt, sand or dung, and assets related to information (such as radio, television, phone), mobility, or livelihood
These multiple deprivations are combined into an index that reflects both the number of people regarded as being poor in terms of deprivations and the number of deprivations that they suffer. A headcount ratio is published showing the percentage of the population who are poor under this definition.
Exam tip: Lack of access to a radio, television, or phone would be seen as a significant deprivation when considered as part of a poverty indicator. These items are not luxuries but essential tools for accessing information, opportunities, and services that can help people escape poverty.
Characteristics of developing countries
There are many other indicators that can be used to capture the varied characteristics of developing countries that may contribute to their progress (or otherwise) in achieving development. The pattern of economic activity may be important, as heavy dependence on low-productivity agriculture may hinder economic growth.
Access to good infrastructure can be captured by data on access to electricity, sanitation, or clean water. Transport and communications are also vital for development, so access to the internet or mobile phones, and the quality of roads, are all important indicators that can provide clues to the problems faced by particular countries.
The following table presents data for three countries across a range of indicators:
| Indicator | Country A | Country B | Country C |
|---|---|---|---|
| Life expectancy at birth (years) | 67.0 | 66.7 | 60.2 |
| Expected years of schooling | 10.2 | 8.3 | 11.8 |
| Skilled labour (% of labour force) | 18.5 | 40.5 | 17.9 |
| Mobile cellular subscriptions (per 100 people) | 40.6 | 114.2 | 93.5 |
| Unemployment (% of total labour force) | 2.5 | 5.7 | 25.5 |
| HIV/AIDS prevalence (% population aged 15-49) | 0.3 | 4.2 | 26.8 |
| Survival to age 65 (male, % of cohort) | 64.7 | 61.5 | 40.3 |
| Agriculture value added (% GDP) | 25.1 | 23.0 | 8.4 |
| Gini coefficient (%) | 42.6 | 40.8 | 54.6 |
Source: World Bank/United Nations
Notice from the varied pattern of the data that there does not appear to be a strong association between poverty and average incomes. Each country shows different strengths and weaknesses across the various indicators, highlighting the complexity of measuring and understanding development.
This data illustrates how different countries face different challenges and have different characteristics that affect their development path. Some may have good education systems but poor health outcomes, while others may have achieved progress in reducing poverty but struggle with high unemployment or inequality.
Key Points to Remember:
-
Development is broader than growth: Development encompasses improvements in quality of life, not just increases in income. It includes education, health, and living standards.
-
HDI provides a composite measure: The Human Development Index combines three dimensions (health, education, and living standards) to give a more rounded picture of development than GNI per capita alone.
-
Multiple indicators are necessary: No single statistic can fully capture the complexity of development. Different indicators reveal different aspects of a country's development challenges and progress.
-
Inequality matters: The Inequality-adjusted HDI and other measures show that average statistics can hide significant disparities within countries. High inequality can substantially reduce effective human development.
-
Development priorities vary: Different countries have taken different approaches to development, with some prioritising economic growth and others focusing more on education and healthcare provision. This diversity means each country requires tailored development strategies.