Neutralisation (OCR A-Level Chemistry A): Revision Notes
Neutralisation
Introduction to pH titration curves
Acid-base titrations are analytical techniques used to determine the concentration of an acid or base by monitoring neutralisation reactions. During a titration, the pH changes as one solution is gradually added to another. These pH changes can be monitored and analyzed to provide valuable information about the solutions involved.
A pH meter provides more accurate measurements than indicator paper and is the preferred method for monitoring pH changes during titrations. While indicator paper typically gives pH values to the nearest whole number, a pH meter can record measurements to two decimal places, allowing for precise analysis of the reaction.

Using a pH meter
A pH meter uses an electrode placed in the solution being tested. The electrode connects to a digital meter that displays the pH reading with high precision.
Standard procedure for acid-base titration:
- Add a measured volume of acid to a conical flask using a pipette
- Place the pH meter electrode in the flask, ensuring it is fully immersed
- Add the aqueous base from a burette in portions
- After each addition, swirl the flask contents and record both the pH and total volume of base added
- Continue adding base in portions until the pH begins to change more rapidly
- Once rapid pH changes are observed, add the base dropwise (smaller volumes) to capture the vertical section accurately
- Return to additions once the pH is changing slowly again
- Continue until excess base has been added and the pH stabilizes at a high value
The results are then plotted as a graph of pH (y-axis) against total volume of base added (x-axis), producing a characteristic S-shaped titration curve.
Alternative automated method: The pH meter can be connected to a datalogger with magnetic stirring. The base is added slowly from the burette, and the datalogger automatically records pH measurements and plots the titration curve using computer software.
Key features of pH titration curves
When analyzing a pH titration curve for a strong acid-strong base titration, several distinct regions can be identified:
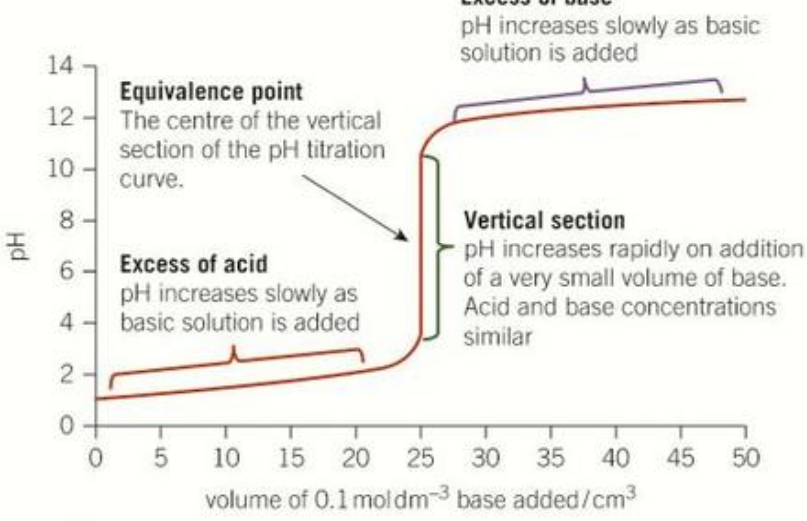
Initial excess acid region: When base is first added, the acid is present in large excess. The pH increases very slowly as small amounts of acid are neutralized. The pH remains low (around 1-3) during this stage.
Vertical section: As more base is added, the acid concentration decreases significantly. Eventually, the pH increases very rapidly with the addition of only a few drops of base. This produces the characteristic steep, vertical section of the curve. During this section, the pH can change by 8-10 units with the addition of less than of base.
Equivalence point: The centre of the vertical section represents the equivalence point. This is the point where stoichiometric amounts of acid and base have reacted completely according to the balanced equation. The volumes used match the stoichiometry of the neutralisation reaction:
For a strong acid-strong base titration, the equivalence point occurs at pH 7 (neutral solution).
Excess base region: After passing through the equivalence point, the base is now in excess. Further additions of base cause the pH to increase slowly again as the basic solution becomes more concentrated. The pH stabilizes at a high value (around 12-13).
Adding acid to a base
pH titration curves can also be constructed by adding acid to base, rather than adding base to acid. The shape of the curve is essentially inverted - it starts at high pH and decreases to low pH.
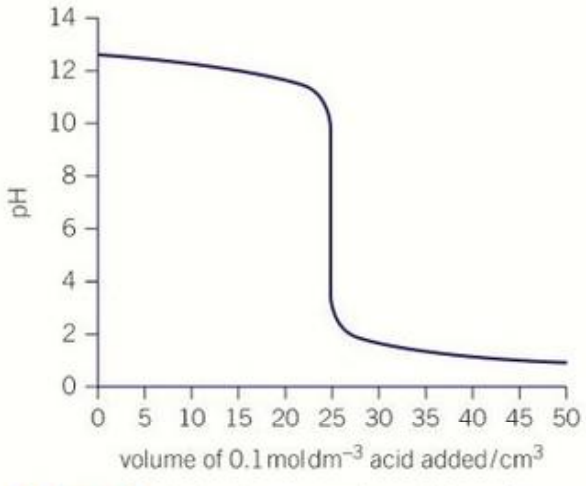
The curve begins at high pH (around 13) when the base is in excess. As acid is added, the pH remains relatively constant until approaching the equivalence point. The vertical section still appears, but now shows a rapid decrease in pH. After the equivalence point, excess acid causes the pH to level off at a low value (around 1-2).
The equivalence point is still at the centre of the vertical section, and for strong acid-strong base titrations, this occurs at pH 7.
Acid-base indicators
The end point
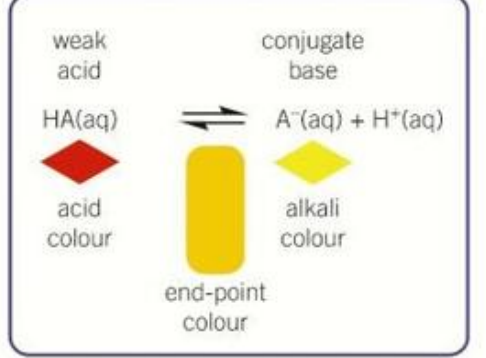
Indicators provide a visual method for detecting when a neutralisation reaction is complete. An acid-base indicator is a weak acid (represented as HA) where the molecular form and its conjugate base (A⁻) display distinctly different colors.
For methyl orange, a commonly used indicator:
- The weak acid form, HA(aq), appears red
- The conjugate base form, A⁻(aq), appears yellow
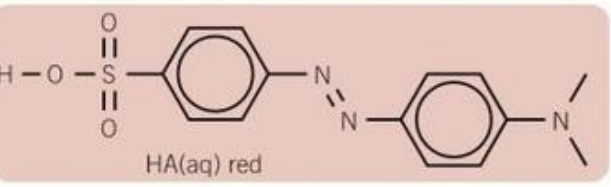
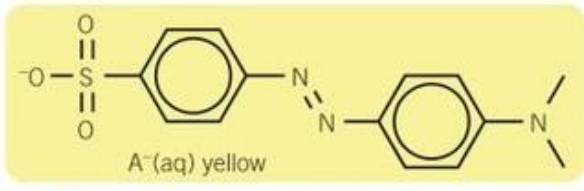
The indicator exists in equilibrium between these two forms:
The end point of a titration occurs when the indicator contains equal concentrations of HA and A⁻. At this point, the color observed is intermediate between the two extreme colors. For methyl orange, the end point appears orange - a blend of the red acid form and yellow base form.
Explaining indicator color changes
Indicators function through equilibrium shifts driven by changes in hydrogen ion concentration. Understanding Le Chatelier's principle helps explain these color changes.
When strong base is added to strong acid containing methyl orange:
Initially, the high concentration of H⁺ ions drives the equilibrium position far to the left, favoring the acid form HA. The solution appears red.
When OH⁻(aq) ions are added:
- OH⁻ ions react with H⁺ ions in the solution:
- This removes H⁺ ions, causing the weak acid HA to dissociate further
- The equilibrium shifts to the right
- The color changes progressively from red through orange (at the end point) to yellow as the equilibrium position shifts
When acid is added to base containing methyl orange:
The process reverses:
- H⁺(aq) ions react with the conjugate base form A⁻(aq)
- This removes A⁻ from the equilibrium
- The equilibrium shifts to the left
- The color changes from yellow through orange (at the end point) to red
This mechanism is analogous to how buffer solutions resist pH changes - the indicator itself acts as a weak acid-base system.
Sensitivity of the end point
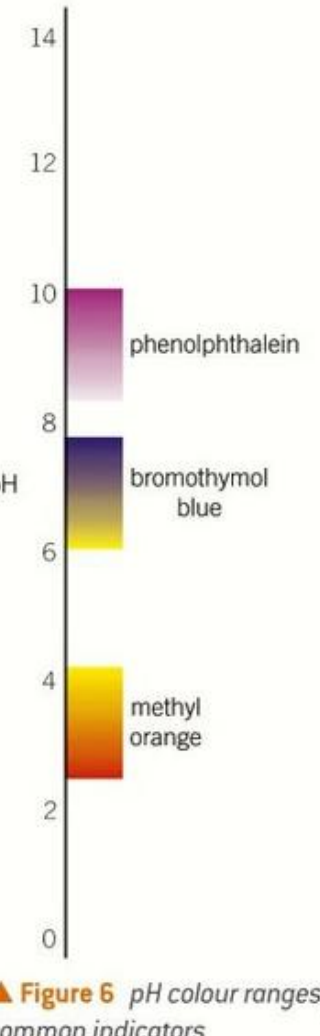
Different indicators undergo color changes over different pH ranges, determined by their acid dissociation constant () values.
At the end point of an indicator:
- Therefore:
- This means:
The pH at which an indicator changes color equals its pKa value.
The sensitivity depends on the indicator chosen and human eyesight limitations. Most indicators undergo color changes over a range of approximately 2 pH units.
The pH ranges and colors for several common indicators are shown below:
| Indicator | pH range |
|---|---|
| Thymol blue | 1.2-2.8 |
| Bromophenol blue | 3.6-4.6 |
| Methyl red | 4.4-6.2 |
| Metacresol purple | 7.4-9.0 |
| Indigo carmine | 11.4-13.0 |
Choosing the indicator
Selecting an appropriate indicator is crucial for accurate titration results. The indicator's color change range must coincide with the vertical section of the pH titration curve.
Ideal scenario: The end point and equivalence point should coincide. In practice, they may differ slightly (by one or two drops, equivalent to ), but this difference is negligible in analytical terms.
Key principle: The indicator must change color completely within the pH range covered by the vertical section of the titration curve.
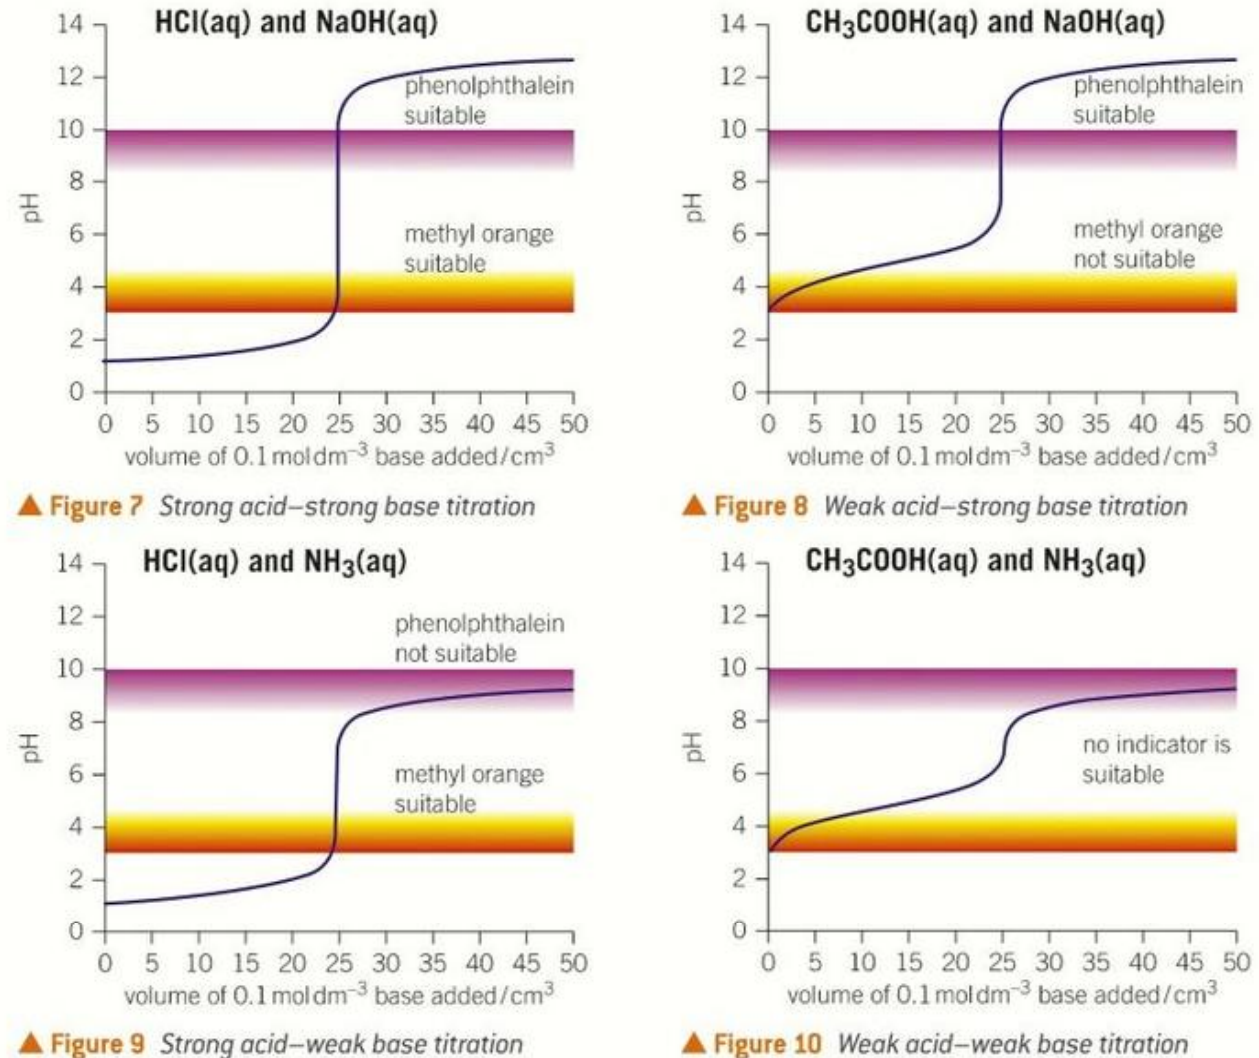
Strong acid-strong base titration (e.g., HCl and NaOH):
- Large vertical section spanning pH 3-11
- Both methyl orange (pH 3-4) and phenolphthalein (pH 8-10) are suitable
- Either indicator will change color sharply at the equivalence point
Weak acid-strong base titration (e.g., CH₃COOH and NaOH):
- Smaller vertical section on the basic side (approximately pH 7-11)
- Phenolphthalein is suitable (pH 8-10 falls within the vertical section)
- Methyl orange is NOT suitable (pH 3-4 is too acidic and not in the vertical section)
Strong acid-weak base titration (e.g., HCl and NH₃):
- Smaller vertical section on the acidic side (approximately pH 3-7)
- Methyl orange is suitable (pH 3-4 falls within the vertical section)
- Phenolphthalein is NOT suitable (pH 8-10 is too basic and not in the vertical section)
Weak acid-weak base titration (e.g., CH₃COOH and NH₃):
- No distinct vertical section - the pH changes very gradually
- The steepest point still requires several cm³ to pass through typical indicator ranges
- NO standard indicator is suitable for this type of titration
- A pH meter must be used instead
Key Points to Remember:
- Equivalence point vs end point: The equivalence point is where stoichiometric amounts have reacted (centre of vertical section), while the end point is where the indicator shows equal concentrations of its acid and base forms
- pH meter accuracy: pH meters record values to 2 decimal places, making them far more precise than indicator paper (which only gives whole number values)
- Vertical section importance: Only indicators that change color within the vertical section of the curve are suitable for that specific titration
- Indicator equilibrium: Indicators are weak acids where pKa = pH at the end point, and they change color over approximately a 2 pH unit range
- Weak acid-weak base limitation: No indicator is suitable for weak acid-weak base titrations because there is no sharp vertical section in the pH curve
Exam Focus Checklist:
- ✓ Be able to sketch and label pH titration curves for different acid-base combinations
- ✓ Explain the difference between equivalence point and end point
- ✓ Select appropriate indicators based on the pH range of the vertical section
- ✓ Describe the equilibrium changes that cause indicator color changes
- ✓ Remember that weak acid-weak base titrations require a pH meter, not an indicator