Rate–Concentration Graphs (OCR A-Level Chemistry A): Revision Notes
Rate–Concentration Graphs
Introduction to rate-concentration graphs
Rate-concentration graphs display how the rate of a chemical reaction changes with varying concentrations of reactants. These graphs are incredibly valuable tools in chemical kinetics because they provide a direct visual link between the rate of reaction and concentration, which helps us determine the rate equation for a reaction.
By plotting experimental rate data against concentration, we can identify the order of reaction with respect to each reactant. The shape of the resulting graph immediately reveals whether a reaction is zero, first, or second order with respect to a particular reactant.
The beauty of rate-concentration graphs lies in their simplicity: different reaction orders produce distinctly different graph shapes, allowing quick visual identification of reaction kinetics without complex calculations.
Determining reaction order from graph shapes
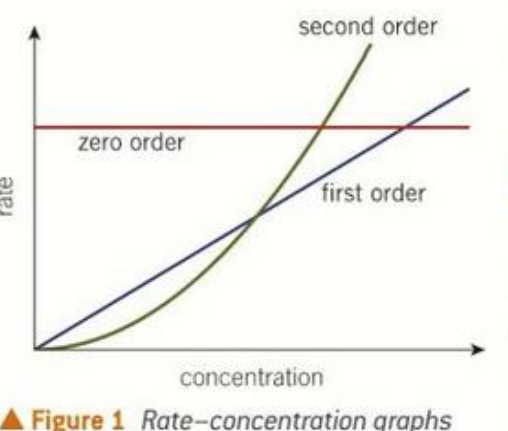
The appearance of a rate-concentration graph tells us the order of reaction with respect to a specific reactant. Each order produces a characteristic shape that allows quick identification.
Zero order reactions
A zero order reaction produces a horizontal straight line when rate is plotted against concentration. This horizontal line has zero gradient, meaning the rate does not change as concentration increases.
For a zero order reaction with respect to reactant A:
Since any value raised to the power of zero equals 1:
Key characteristics:
- The rate remains constant regardless of concentration changes
- The y-intercept of the horizontal line gives the value of the rate constant
- Concentration has no effect on how fast the reaction proceeds
This situation often occurs when something other than the reactant concentration controls the reaction rate, such as surface area in heterogeneous catalysis.
First order reactions
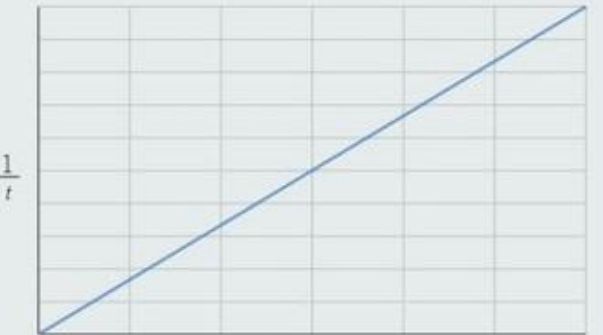
A first order reaction produces a straight line passing through the origin when rate is plotted against concentration. This diagonal line shows that rate is directly proportional to concentration.
For a first order reaction with respect to reactant A:
Key characteristics:
- Rate increases linearly with concentration
- The line passes through the origin (when concentration is zero, rate is zero)
- The gradient of the straight line equals the rate constant
- Doubling the concentration doubles the rate
Finding the rate constant:
The rate constant can be determined by measuring the gradient of the straight line. Since the line represents , rearranging gives , which is the gradient.
Second order reactions
A second order reaction produces an upward curving line with increasing gradient when rate is plotted against concentration. The curve shows that rate increases more rapidly than concentration.
For a second order reaction with respect to reactant A:
Key characteristics:
- The graph is a curve, not a straight line
- The gradient increases as concentration increases
- Doubling the concentration quadruples the rate
- The rate constant cannot be obtained directly from this curved graph
Finding the rate constant:
Since the original graph is curved, we need to transform the data to get a straight line. By plotting rate against (concentration squared), we obtain a straight line through the origin. The gradient of this new straight line equals the rate constant .
Common Mistake Alert:
For second order reactions, you CANNOT read the rate constant directly from the curved rate vs. concentration graph. You must first plot rate vs. to obtain a straight line, then calculate the gradient of that transformed graph.
Worked example: determining rate constant from a rate-concentration graph
Worked Example: Finding the Rate Constant
Consider the decomposition of dinitrogen pentoxide:
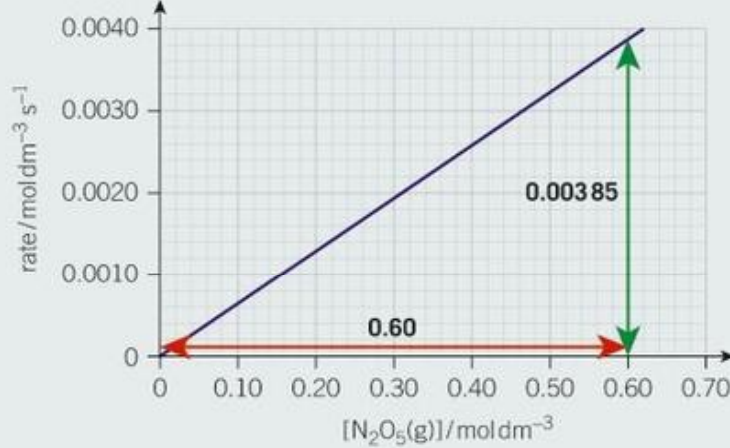
Step 1: Determine the order and rate equation
The graph shows a straight line passing through the origin, indicating a first order reaction with respect to N₂O₅. Therefore:
Step 2: Calculate the rate constant from the gradient
For a first order reaction, the gradient of the line equals the rate constant:
Notice that the units of for a first order reaction are s⁻¹ (per second), which makes sense since rate has units mol dm⁻³ s⁻¹ and concentration has units mol dm⁻³.
Log-log graphs
Log-log graphs provide an alternative method for determining both the order of reaction and the rate constant simultaneously. This approach is particularly useful when you're unsure of the reaction order or when dealing with complex data.
The principle behind log-log graphs
Starting with the general rate equation for reactant A:
Taking logarithms of both sides:
This logarithmic form matches the equation of a straight line , where:
- (the order of reaction)
- (from which can be calculated)
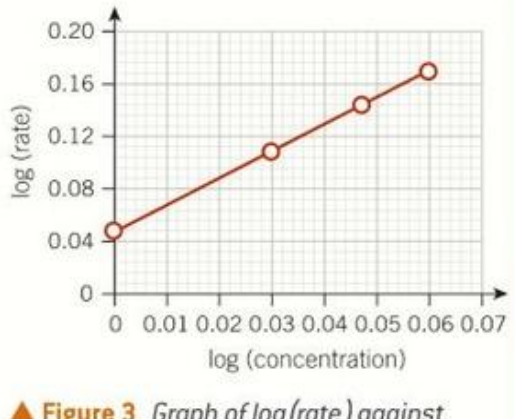
Using log-log graphs
When you plot on the y-axis against on the x-axis, you get a straight line. The gradient of this line gives the order of reaction , and the y-intercept gives , from which the rate constant can be calculated by taking the antilog.
Advantages of log-log graphs:
- Determines both order and rate constant from one graph
- Works for any order of reaction
- Particularly useful when the order is not immediately obvious
- Converts all reaction orders into straight lines, making analysis simpler
The initial rates method
What is the initial rate?
The initial rate is the instantaneous rate of reaction at the very start of the reaction when time . At this point, the concentration of reactants is at its maximum and has not yet been affected by the reaction.
The initial rate can be found by drawing a tangent to the concentration-time curve at and measuring its gradient. This tangent represents the steepest part of the curve, showing the fastest rate at the beginning of the reaction.
Clock reactions
Clock reactions offer a more practical and convenient method for measuring initial rates without needing to draw tangents on graphs. These reactions involve measuring the time taken for a visible change to occur, such as:
- A color change
- The appearance of a precipitate
- The disappearance of a color
The principle:
When a clock reaction is performed, the time from the start of the experiment until the visible change appears is measured. Provided that no significant change in rate occurs during this time, we can assume that the average rate over this period equals the initial rate.
The initial rate is proportional to :
Experimental procedure:
- The clock reaction is performed several times using different concentrations of one reactant while keeping all other concentrations constant
- For each experiment, the time is measured
- Values of are calculated for each concentration
- A graph of (which is proportional to rate) is plotted against concentration
- The shape of this graph reveals the order with respect to that reactant
- The process is repeated for other reactants
Iodine clock reactions
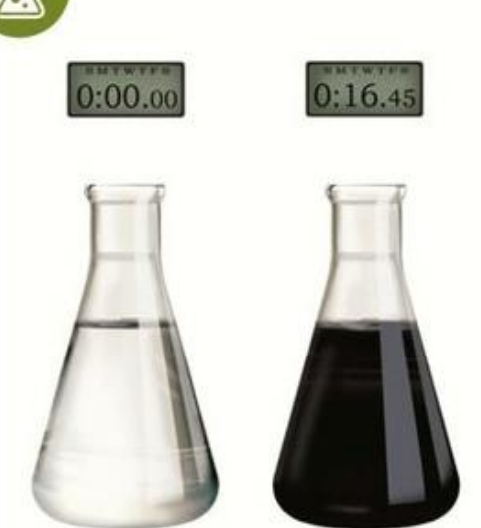
The iodine clock is one of the most common types of clock reaction used in schools and colleges. It relies on the formation of iodine, which has a distinctive orange-brown color in aqueous solution.
How it works:
The reaction mixture contains:
- The reactants being studied
- Iodide ions (I⁻)
- A small fixed amount of sodium thiosulfate (Na₂S₂O₃)
- Starch solution
As the reaction proceeds, iodine (I₂) is produced. However, the thiosulfate ions immediately react with the iodine as it forms, preventing any color change. The relevant equation is:
When all the thiosulfate ions have been used up, the next iodine molecules produced remain in solution and immediately form a complex with starch, producing an intense blue-black color. This dramatic color change marks the endpoint.
Procedure:
- Start with a colorless solution
- Measure the time until the blue-black color suddenly appears
- This time represents the period for a fixed small amount of reaction to occur
- Initial rate is proportional to
Why thiosulfate is important:
The thiosulfate ions effectively delay the color change by removing iodine as it forms. The same volume of thiosulfate solution must be used in each experiment to ensure that the same amount of reaction occurs before the color appears, making the measurements comparable.
Worked example: rate equation from a clock reaction
Worked Example: Determining Rate Equation Using Clock Reaction
Consider the reaction between hydrogen peroxide (H₂O₂) and iodide ions in acidic solution:
Five experiments are performed with different concentrations of hydrogen peroxide while keeping the concentrations of iodide ions and acid constant. The time for the blue-black color to appear is measured.
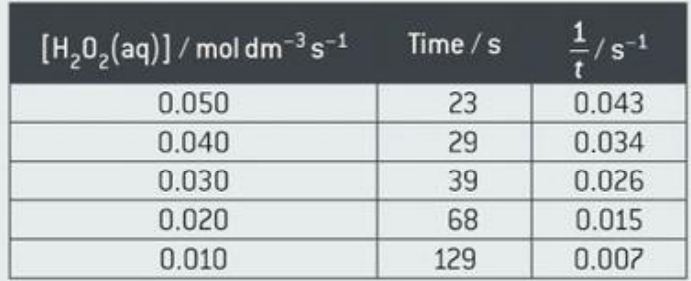
Analyzing the data:
First, calculate for each concentration, since this is proportional to the initial rate:
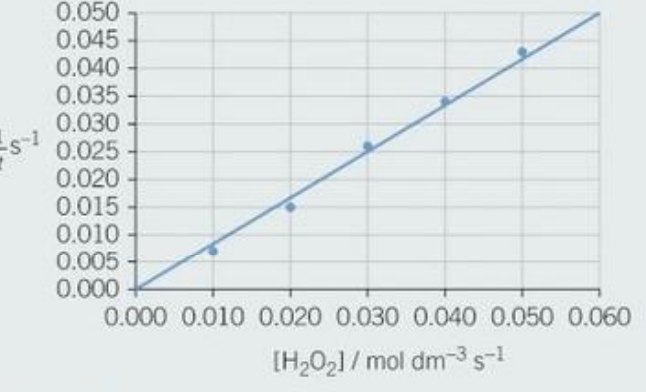
Step 1: Plot the rate-concentration graph
When is plotted against [H₂O₂], a straight line through the origin is obtained. This indicates that the reaction is first order with respect to H₂O₂.
Step 2: Repeat for other reactants
Two further series of experiments are performed:
- One varying [I⁻] while keeping [H₂O₂] and [H⁺] constant
- One varying [H⁺] while keeping [H₂O₂] and [I⁻] constant
Suppose these graphs show:
- Straight line through origin for I⁻: first order with respect to I⁻
- Horizontal line for H⁺: zero order with respect to H⁺
Step 3: Write the rate equation
Combining all the orders:
Since [H⁺]⁰ = 1, this simplifies to:
Important note:
Even though H⁺ appears in the balanced equation, it is zero order, so it doesn't appear in the final rate equation. This is a common situation and highlights why rate equations must be determined experimentally rather than from the balanced equation.
Accuracy of clock reactions
Clock reactions provide a reasonably accurate measure of initial rate, but there are limitations to consider.
Understanding the approximation
In a clock reaction, you are measuring the average rate during the first part of the reaction. The shorter the time period measured, the less the rate changes during that period, and the more accurately it represents the initial rate.
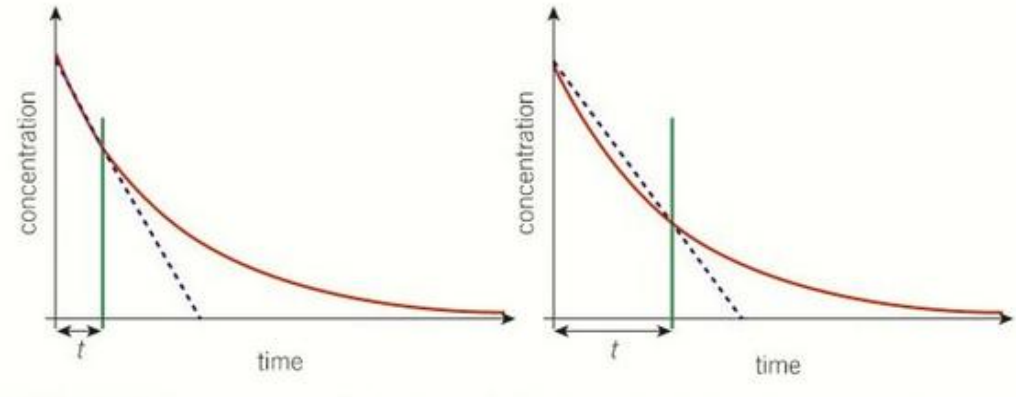
The two graphs show concentration-time curves with different measurement periods:
- Left graph: Short time period - the rate barely changes, so the average rate is very close to the initial rate
- Right graph: Longer time period - the rate changes more noticeably, creating a larger difference between the average rate and the true initial rate
When are clock reactions accurate?
The 15% Rule:
Clock reactions are reasonably accurate provided that less than 15% of the reaction has occurred during the measured time period. Within this limit, the rate has not changed significantly from its initial value.
Beyond 15% completion, the concentration has changed enough that the rate differs substantially from the initial rate, making the approximation less valid.
Practical implications
To ensure accuracy:
- Keep the amount of thiosulfate small (so the reaction doesn't proceed too far)
- Use concentrations that give measurable times (not too fast or too slow)
- Recognize that faster reactions (shorter times) generally give more accurate initial rates
- Understand that very long times indicate that too much reaction has occurred for the approximation to be valid
The accuracy of the initial rate method depends critically on how quickly you can make your measurements. The faster the endpoint is reached, the less the concentration has changed, and the more accurate your initial rate measurement will be.
Summary
Key Points to Remember:
-
Graph shapes reveal order: Zero order gives a horizontal line, first order gives a straight line through the origin, and second order gives an upward curve with increasing gradient
-
Rate constant from gradient: For first order reactions, the rate constant equals the gradient of the rate-concentration graph
-
Log-log graphs are versatile: They provide both the order (from gradient) and rate constant (from intercept) in one plot
-
Initial rate proportional to 1/t: In clock reactions, dividing 1 by the time gives a value proportional to the initial rate
-
Accuracy requires <15% completion: Clock reactions only give accurate initial rates when less than 15% of the reaction has occurred during the measured time
-
Orders must be determined experimentally: The order with respect to each reactant cannot be predicted from the balanced equation and must be found through experimental investigation