Income statements (AQA GCSE Business): Revision Notes
Income statements
What is an income statement?
An income statement is a crucial financial document that summarises how a business has performed over a specific period, typically one year. Think of it as a financial report card that shows whether the business made a profit or loss during that time. The income statement reveals the story of a company's trading activities and helps stakeholders understand how well the business is managing its operations.
Income statements are used by various stakeholders including managers (for decision-making), investors (for investment decisions), lenders (for credit assessments), and tax authorities (for tax calculations). Each group uses the information differently but all rely on the same fundamental document.
The primary purpose of an income statement is to track the flow of money through a business, starting with the total sales revenue and working down through various costs and expenses to arrive at the final profit figure. This document is essential for managers, investors, and other stakeholders who need to assess the financial health and performance of a business.
Understanding the structure
Income statements follow a logical structure that moves from the top line (revenue) down to the bottom line (profit after tax). Each line item represents a different stage in the profit calculation, and understanding this flow is key to interpreting business performance effectively.
The structure of an income statement is standardised and follows a strict logical sequence. You cannot rearrange the components - each builds upon the previous one to create a clear picture of how profit is generated step by step.
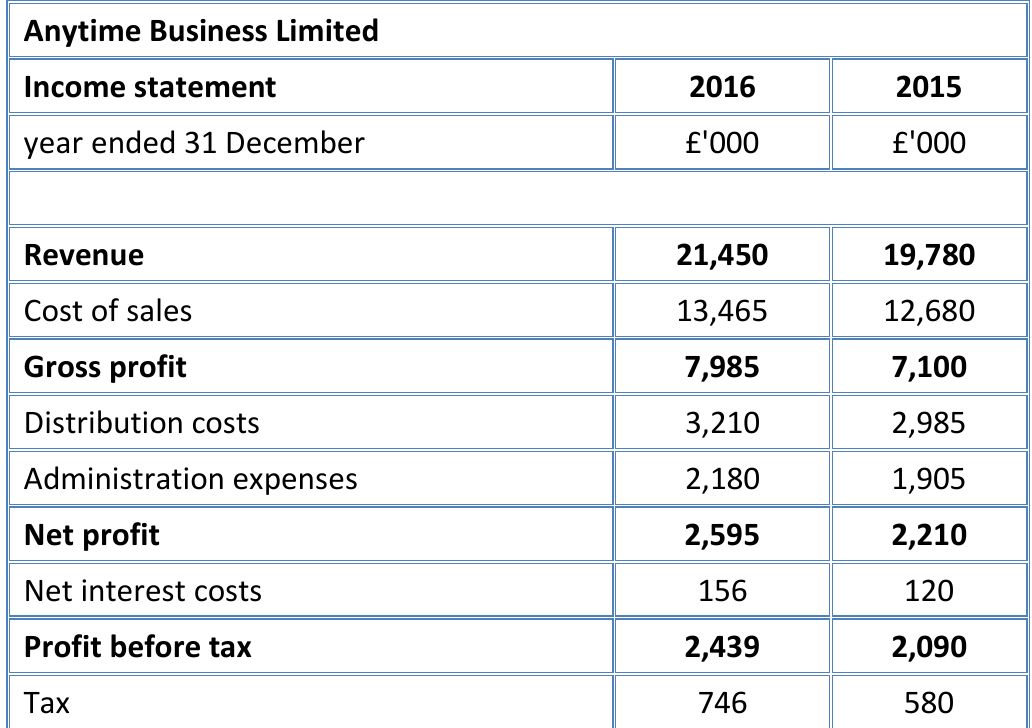
The example above shows how an income statement is typically laid out, with comparative figures from previous years helping to identify trends and changes in performance. Notice how the figures are presented in thousands of pounds, which is common practice for larger businesses to make the numbers more manageable to read.
Key components of an income statement
Revenue
Revenue represents the total value of sales made to customers during the accounting period. This is often called the "top line" because it appears at the top of the income statement. Revenue includes all money earned from the business's main trading activities, whether the cash has been received yet or not.
Revenue is recorded when a sale is made, not necessarily when cash is received. This is called the "accruals concept" in accounting - it ensures that the income statement reflects the business's trading activity during the period, regardless of when cash changes hands.
It's important to understand that revenue is not the same as profit - it's simply the total amount of sales before any costs are deducted. A business might have high revenue but still make a loss if its costs are too high.
Cost of sales
Cost of sales encompasses all the direct costs involved in producing the goods or services that generated the revenue. This includes raw materials, components, goods purchased for resale, and the direct labour costs of production. These are costs that vary directly with the level of sales - if you sell more, these costs increase proportionally.
Understanding cost of sales is crucial because it helps businesses see how efficiently they're producing their goods or services. A business that can keep its cost of sales low relative to revenue will have a stronger foundation for profitability.
Gross profit
Gross profit is calculated using the formula:
This figure shows how much money the business has made from its core trading activities before accounting for any overhead expenses. Gross profit is a vital indicator of a business's operational efficiency and pricing strategy.
Many businesses also calculate their gross profit margin, which expresses gross profit as a percentage of revenue using the formula: . This helps with comparisons over time and against competitors.
Distribution and administration expenses
These are the operating costs and expenses that aren't directly related to producing goods or services. Distribution expenses might include delivery costs, warehouse expenses, and marketing activities. Administration expenses cover office costs, management salaries, insurance, and other overhead expenses necessary to run the business.
These expenses are sometimes called "overheads" because they sit above the direct costs of production. Managing these effectively is crucial for profitability, as they need to be covered by the gross profit to generate a net profit.
Net profit
Net profit is a fundamental measure calculated as:
This shows how much profit the business has made from its trading activities after all operating expenses have been deducted.
Net profit is particularly important because it reveals the profit generated purely from the business's core operations, before considering any financing costs or tax implications. A consistently strong net profit indicates effective management of both production costs and overhead expenses.
Finance expenses
Finance expenses represent the cost of borrowing money, typically shown as interest paid on loans or overdrafts. Alternatively, if a business has investments that generate income, this might show as finance income. The net effect of these financial activities is then factored into the profit calculation.
These expenses are separated from operating costs because they relate to how the business is financed rather than how it operates. Two identical businesses might have very different finance expenses depending on their funding structures.
Profit before tax
This figure is calculated by adjusting the net profit for any finance expenses or income:
It represents the profit that the business has made before the government takes its share through taxation. This is an important measure because it shows the business's earning power before the impact of tax, which can vary based on tax rates and policies.
Tax
The tax line shows an estimate of corporation tax or income tax that will be payable on the profit before tax. This is typically calculated as a percentage of the profit before tax, though the exact rate depends on current tax legislation and the business's specific circumstances.
Understanding the tax component helps explain why there's often a significant difference between profit before tax and profit after tax, and why businesses need to plan for their tax obligations.
Profit after tax
This is the final profit figure - the amount of money that remains after all costs, expenses, and taxes have been deducted from revenue:
This profit can either be retained within the business for reinvestment in growth and development, or distributed to owners and shareholders in the form of dividends.
Profit after tax is often considered the most important single figure in the income statement because it represents the actual wealth created by the business for its owners. This is the money available for dividends or reinvestment.
Analysing business performance
When examining an income statement, it's helpful to look at trends over time and consider the relationships between different components. Understanding how to interpret these figures is essential for making informed business decisions.
Worked Example: Analysing Anytime Business Limited
Let's examine the performance between 2015 and 2016:
Revenue Analysis:
- 2015: £19,780,000
- 2016: £21,450,000
- Growth: £1,670,000 (8.4% increase)
Profit Analysis:
- All profit levels increased year-on-year
- Gross profit, net profit, and profit after tax all showed positive growth
- This indicates the business grew revenue while controlling costs effectively
Key Insight: The simultaneous increase in revenue and profit margins suggests good management and a healthy business model, rather than just volume growth at the expense of profitability.
The key to understanding business performance through income statements is recognising that profit growth should ideally come from both revenue increases and cost management, rather than just one or the other. A business that can increase its revenue while keeping costs under control is likely to be more sustainable and successful in the long term.
Key Points to Remember:
- Income statements show a business's trading performance over a specific period, usually one year
- The structure flows logically from revenue at the top down to profit after tax at the bottom
- Key formulas:
- Gross profit = Revenue - Cost of sales
- Net profit = Gross profit - operating expenses
- Profit after tax = Profit before tax - tax
- Multiple profit levels (gross, net, before tax, after tax) each tell a different part of the business performance story
- Comparing figures year-on-year helps identify trends and assess whether business performance is improving or declining
- Strong businesses show growth in both revenue and profit margins, indicating effective cost management alongside sales growth