Interpreting financial statements (AQA GCSE Business): Revision Notes
Interpreting financial statements
Understanding financial statement analysis
Financial statements like the statement of financial position and income statement contain valuable information that helps users understand how well a business is performing. By analysing these documents, business owners, managers, and other stakeholders can make informed decisions about the company's future direction.
The key purpose of interpreting financial statements is to assess whether a business is doing well or poorly, and to identify areas for improvement. This analysis helps satisfy the needs of various stakeholders and ensures the business can continue to operate successfully.
Financial statement analysis is essential for understanding business performance because it transforms raw financial data into meaningful insights that support strategic decision-making.
Methods of analysing business performance
There are two main approaches to evaluating how well a business is performing financially:
Analysing trends over time involves examining financial data across multiple years to identify patterns. This helps determine whether the business is improving or declining in its performance. For example, you might compare this year's profits with previous years to see if there's a positive or negative trend.
Comparing against competitors and industry standards means looking at how the business performs relative to similar companies or the market as a whole. This benchmarking approach helps identify whether the business is outperforming or underperforming compared to its peers.
Both comparison methods are crucial for getting a complete picture of business performance. Using only one method can lead to misleading conclusions about how well a business is actually performing.
Profitability ratios
Understanding how much profit a business generates is crucial, but the absolute profit figure alone doesn't tell the whole story. Profitability ratios help determine how "profitable" a business truly is by comparing profit levels to revenue. There are two essential profitability ratios you need to know:
- Gross profit margin
- Net profit margin
Gross profit margin
The gross profit margin measures how much gross profit a business earns relative to its total revenue. This ratio shows how effectively a company converts its sales into gross profit after accounting for the direct costs of producing goods or services.
The formula for calculating gross profit margin is:
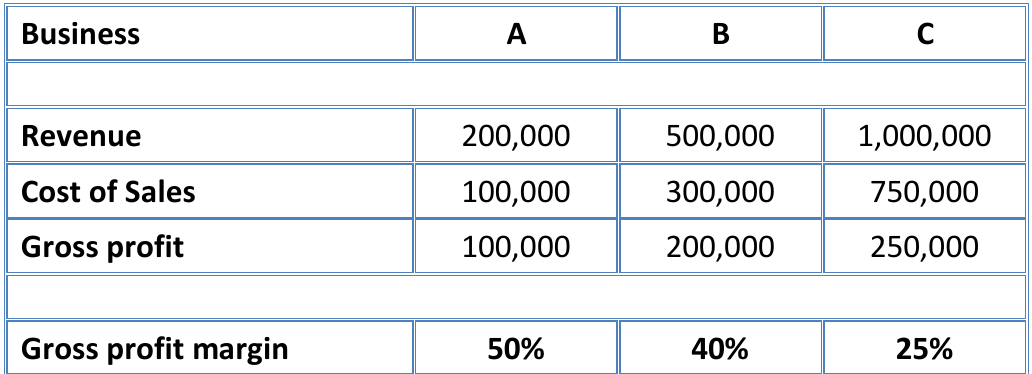
Worked Example: Comparing Gross Profit Margins
Looking at the example above, you can see how different businesses can have vastly different gross profit margins despite varying revenue levels:
- Business A: Achieves the highest gross profit margin at 50%, meaning it keeps 50p of every £1 in sales after covering direct costs
- Business C: Has the lowest margin at 25%, keeping only 25p per £1 of sales
This comparison reveals that having higher revenue doesn't necessarily mean better profitability. Business A generates twice as much profit per pound of sales compared to Business C, despite having much lower total revenue.
These differences might occur because businesses operate in different industries or because some companies are more efficient than others in managing their cost of sales.
Net profit margin
Net profit represents what remains after all business expenses have been deducted from sales revenue. The net profit margin compares this final profit figure to the total revenue, providing insight into overall business efficiency.
The net profit margin is calculated using this formula:
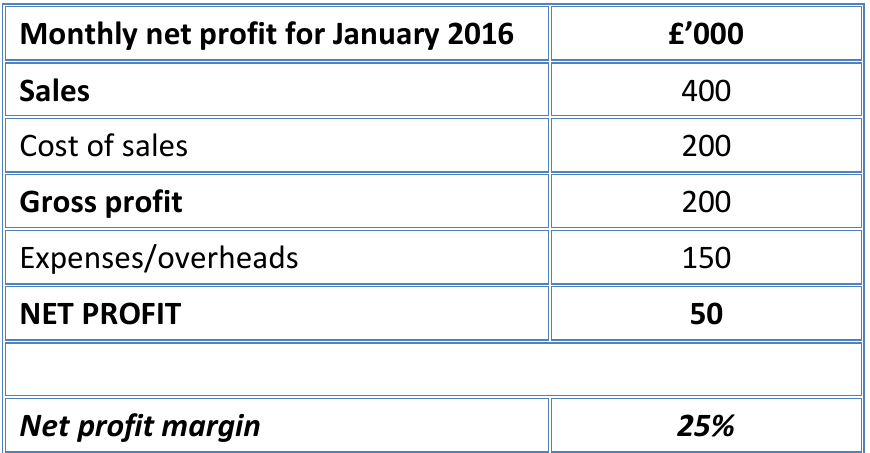
Worked Example: Calculating Net Profit Margin
Using the January 2016 data shown above:
- Revenue: £50,000
- Net Profit: £12,500
Net Profit Margin =
This means the company successfully converted 25% of every pound of sales into final profit - an impressive achievement that demonstrates good cost control and operational efficiency.
The net profit margin is particularly valuable because it reveals:
- How effectively a business converts sales into final profit
- How well a company controls its operating expenses
- Whether the business is efficiently managing all its costs
Comparing business performance using ratios
Profitability ratios become even more useful when you compare them between different businesses or track changes over time. This analysis helps identify which companies are performing better and why.
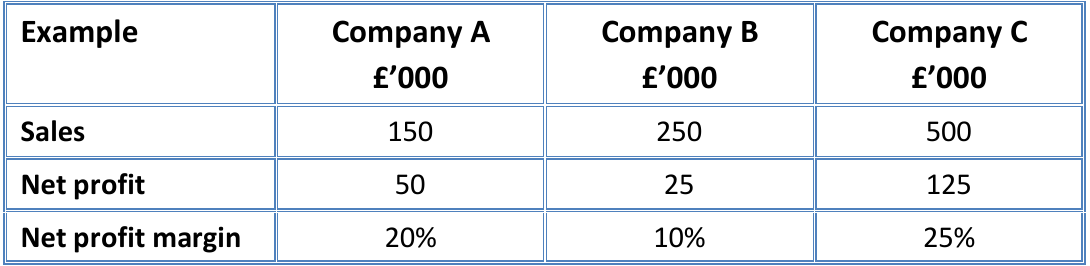
Worked Example: Business Performance Comparison
This comparison demonstrates several important insights:
Company A vs Company B:
- Company A achieves higher net profit (£20,000) than Company B (£15,000) despite having lower sales
- Company A's superior net profit margin (20% vs 10%) shows better cost control and efficiency
Company C:
- Generates the highest net profit margin at 25%
- Has the highest sales volume
- This combination results in the largest absolute profit (£37,500), making it the most successful business in terms of both efficiency and scale
This analysis shows that higher profit margins combined with strong sales volumes typically indicate the most successful businesses. However, even businesses with lower sales can outperform competitors through superior cost management.
Key considerations for decision-making
When interpreting financial statements and ratios, it's important to remember that these figures are tools to support decision-making, not make decisions themselves. Managers must consider various factors including:
- Internal business circumstances
- External market conditions
- The needs and expectations of different stakeholders
- Industry trends and competitive pressures
Financial ratios provide valuable insights, but they should always be used alongside other information to make well-informed business decisions. Never rely on ratios alone when making critical business choices.
Key Points to Remember:
- Financial statements provide crucial information for understanding business performance and making informed decisions
- Two main comparison methods exist: analysing trends over time and benchmarking against competitors
- Gross profit margin shows how effectively a business converts sales into gross profit after direct costs:
- Net profit margin reveals overall business efficiency by comparing final profit to total revenue:
- Higher profit margins generally indicate better business performance, but context and comparisons are essential for meaningful analysis