Quadratic inequalities (AQA GCSE Further Maths): Revision Notes
Quadratic inequalities
What are quadratic inequalities?
Quadratic inequalities are mathematical expressions that involve quadratic terms (expressions with ) and inequality symbols (, , , ) instead of equals signs. Unlike quadratic equations which have specific solutions, quadratic inequalities have ranges of values that satisfy the condition.
These inequalities involve quadratic expressions that can be factorised, which opens up several solution methods. You can solve them by sketching graphs, creating sign charts, or using a systematic approach to find the intervals where the inequality holds true.
Quadratic inequalities are particularly useful in real-world applications where you need to find ranges of values rather than exact solutions, such as determining profit margins or optimal measurements.
Method 1: Graphical approach
The graphical method involves sketching the parabola and identifying where it sits above or below the x-axis.
Step-by-step process
First, rearrange your inequality so that one side equals zero. Then factorise the quadratic expression to find where it crosses the x-axis (the critical values). These crossing points divide the number line into regions where the expression is either positive or negative.
Next, sketch the parabola. If the coefficient of is positive, the parabola opens upwards (U-shape). If it's negative, it opens downwards (∩-shape).
Understanding endpoints
A crucial aspect of the graphical method is knowing when to include or exclude the boundary points:
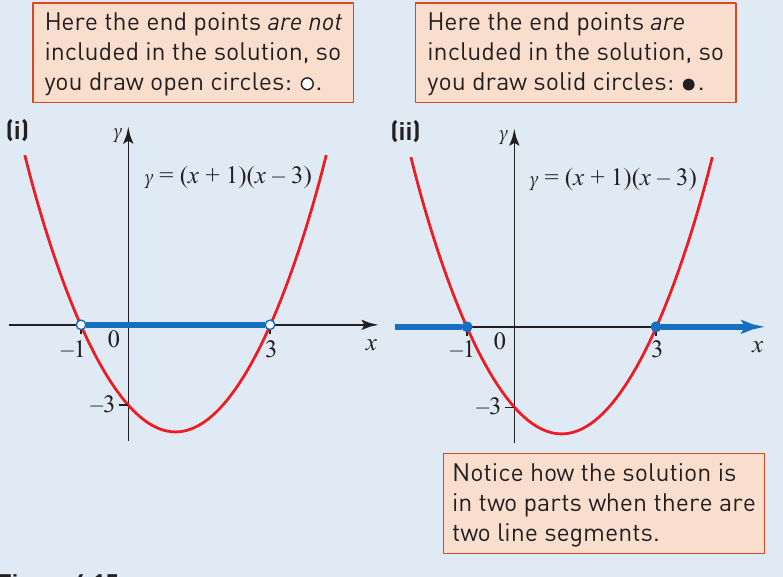
When your inequality uses or , the endpoints are not included in the solution, so you mark them with open circles. When using or , the endpoints are included, so you use solid circles.
Method 2: Sign chart approach
The sign chart method systematically analyses how the sign of each factor changes across different intervals.
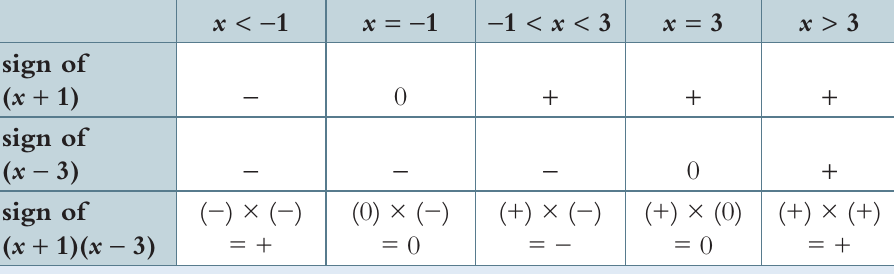 This approach identifies the critical values where each factor equals zero, then examines the sign of each factor in the intervals between these points. By multiplying the signs together, you can determine where the overall expression is positive or negative.
Creating a sign chart
Set up a table with columns for each interval created by your critical values. Add rows for each factor and a final row for the product. Work through each interval, determining whether each factor is positive or negative, then multiply to find the overall sign.
The sign chart method is particularly reliable because it's systematic and reduces the chance of making sign errors. It's especially useful when dealing with more complex quadratic expressions.
Short method for solving quadratic inequalities
Here's a systematic approach that works for any quadratic inequality of the form compared to :
Step 1: Solve to find the critical values and (where )
Step 2: If , multiply the entire inequality by (remember to flip the inequality sign!)
Step 3: For or inequalities, the solution is between the critical values: (or )
Step 4: For or inequalities, the solution is outside the critical values: or (or or )
Worked example 1: Solving
Worked Example: Solving a "Less Than" Inequality
Let's work through this step by step:
Step 1: Factorise the expression:
Step 2: Find the critical values: and (where each factor equals zero)
Step 3: Since we want the expression to be less than zero, we need to find where the parabola is below the x-axis.
Step 4: The parabola crosses the x-axis at and , and since the coefficient of is positive, it opens upwards. This means it's negative (below the x-axis) between the roots.
Solution:
Worked example 2: Solving
Worked Example: Solving a "Greater Than" Inequality
Step 1: Rearrange: becomes
Step 2: Factorise:
Step 3: Find the critical values: and
Step 4: Since we want the expression to be greater than zero, we need the regions where the parabola is above the x-axis. With an upward-opening parabola, this occurs outside the roots.
Solution: or
Important exam tips
Watch out for the inequality direction! When you multiply or divide an inequality by a negative number, you must reverse the inequality sign. This commonly happens when the coefficient of is negative.
Choose your method wisely. The graphical approach gives good visual understanding, while the sign chart method is systematic and less prone to errors. The short method is quickest once you've mastered the pattern.
Double-check your critical values by substituting them back into the original expression - they should make it equal to zero.
Key Points to Remember:
- Quadratic inequalities have ranges of solutions, not just single values
- Open circles (○) are used when endpoints are not included ( or )
- Solid circles (●) are used when endpoints are included ( or )
- For upward-opening parabolas: "less than" means between the roots, "greater than" means outside the roots
- Always reverse the inequality sign when multiplying or dividing by a negative number