The general addition law (AQA GCSE Statistics): Revision Notes
The general addition law
Understanding probability with Venn diagrams
Venn diagrams are powerful visual tools that help us understand probability by representing different events as overlapping circles or shapes. Each shaded area in a Venn diagram represents a specific probability.
When we have two events A and B, there are three key probabilities we need to understand:
P(A) - This represents the probability that event A occurs. In a Venn diagram, this is shown as the entire area of circle A.
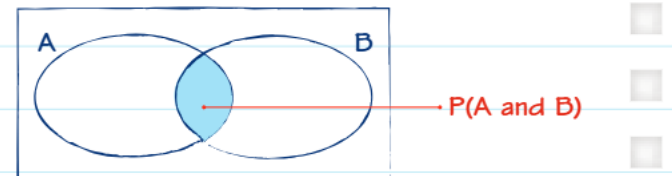
P(A and B) - This represents the probability that both events A and B occur together. This is shown as the overlapping area where the two circles intersect. This intersection is crucial for understanding the general addition law.
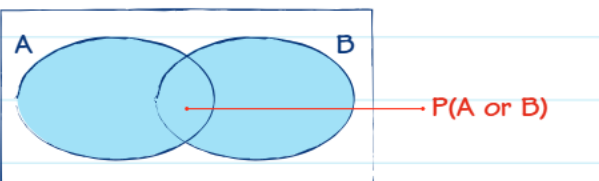
P(A or B) - This represents the probability that either event A occurs, or event B occurs, or both occur. This covers the entire area covered by both circles combined.
The key insight with Venn diagrams is that the intersection represents events happening together, while the union represents events happening separately or together. Understanding this visual representation makes probability calculations much clearer.
The general addition law formula
When events A and B are not mutually exclusive (meaning they can happen at the same time), we use the general addition law to calculate P(A or B).
The formula is:
This formula works because when we add and together, we're actually counting the overlap twice. To get the correct probability, we need to subtract this overlap once to avoid double-counting.
Think of it this way: if you simply add and , you're counting the people or outcomes that satisfy both conditions twice, which gives you a number that's too large. Subtracting corrects this error.
Worked example: Smartphone and tablet ownership
Worked Example: Smartphone and Tablet Ownership
Problem: In a group of 50 students, 21 own a smartphone, 15 own a tablet, and 6 own both a smartphone and a tablet. What is the probability that a randomly selected student owns a smartphone or owns a tablet?
Step 1: Identify the given information
- Total students = 50
- Students with smartphone (S) = 21
- Students with tablet (T) = 15
- Students with both smartphone and tablet = 6
Step 2: Draw a Venn diagram We can organise this information using a Venn diagram to visualise what's happening.
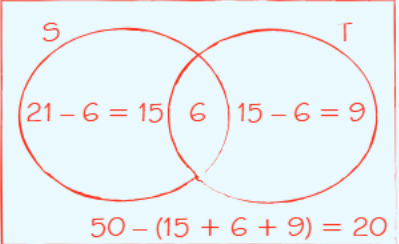
Step 3: Calculate the individual sections
- Students with only smartphone = 21 - 6 = 15
- Students with only tablet = 15 - 6 = 9
- Students with both = 6
- Students with neither = 50 - (15 + 6 + 9) = 20
Step 4: Apply the general addition law
Substituting our values:
Step 5: Verify using the Venn diagram We can check our answer by counting the students who have either a smartphone or a tablet (or both):
- Students with only smartphone: 15
- Students with only tablet: 9
- Students with both: 6
- Total: 15 + 9 + 6 = 30 students
Probability = ✓
Problem-solving approach
Systematic Approach to General Addition Law Problems:
When tackling general addition law problems, follow this methodical approach:
- Identify what you're looking for - Usually
- List the given information - Look for , , and
- Draw a Venn diagram - This helps visualise the problem
- Fill in the diagram systematically - Start with the intersection, then work outwards
- Apply the formula -
- Check your answer - Use the Venn diagram to verify your calculation
Common Mistakes to Avoid:
- Always subtract the intersection - This is the most common mistake students make
- Draw diagrams - Venn diagrams make these problems much clearer
- Check your arithmetic - Make sure all sections of your Venn diagram add up to the total
- Read carefully - Make sure you understand whether the question asks for "and" or "or"
- Express probabilities correctly - As fractions in their simplest form, decimals, or percentages as requested
Key Points to Remember:
- The general addition law is:
- We subtract to avoid double-counting the overlap between events
- Venn diagrams are excellent visual tools for organising probability information
- Always draw a diagram when dealing with two overlapping events - it prevents errors
- Check your final answer by counting sections in your Venn diagram to ensure it makes sense