Tree diagrams (AQA GCSE Statistics): Revision Notes
Tree diagrams
Tree diagrams are powerful visual tools that help us work out probabilities when we have two or more events happening in sequence. They're particularly useful when dealing with independent events, where the outcome of the first event doesn't influence what happens in the second event.
What are tree diagrams?
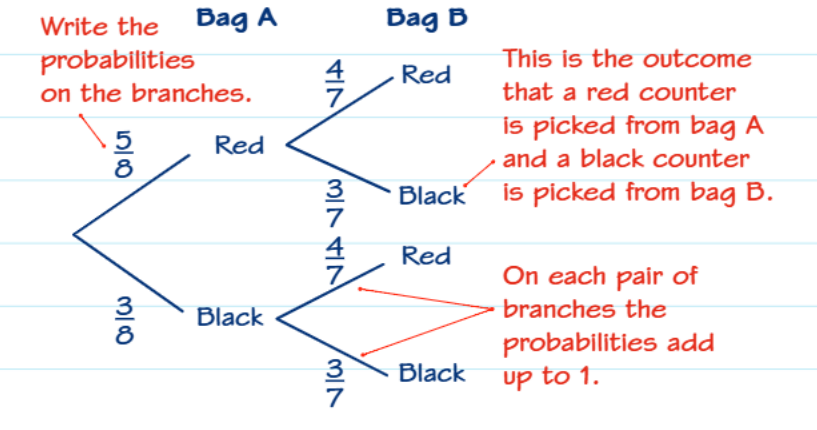
A tree diagram shows all the possible outcomes when events happen one after another. Think of it like a branching tree - you start with one point and then branch out to show each possible outcome at each stage. Each branch represents a possible outcome, and we write the probability of that outcome occurring on the branch.
The visual structure of tree diagrams makes them incredibly intuitive. Each "branch" literally represents a path you could take through the sequence of events, making it easy to see all possible combinations at a glance.
Understanding independent events
Independent events are crucial to understanding when tree diagrams work best. Two events are independent when the outcome of the first event has no effect on the outcome of the second event. For example, if you're picking counters from two separate bags, what you pick from the first bag doesn't change what's available in the second bag.
When events are independent, the probability of each outcome in the second stage remains the same regardless of what happened in the first stage. This is why you'll often see the same probabilities on the second set of branches, no matter which first branch you followed.
How to construct a tree diagram
Building a tree diagram follows a logical structure:
- Start with the first event: Draw branches from your starting point for each possible outcome of the first event
- Write probabilities on branches: Each branch should be labelled with its probability
- Check your work: The probabilities on each set of branches must always add up to
- Add the second event: From each end point of your first branches, draw new branches for each possible outcome of the second event
- Label the second stage: Write the probabilities on these branches too
The key insight is that probabilities on each pair of branches will always total , because they represent all the possible outcomes at that stage.
Golden rules for tree diagrams
Fundamental Rules for Tree Diagrams
Multiplication rule: When you want to find the probability that both events occur (following a path through the tree), you multiply the probabilities along that path. This makes sense because you need both events to happen.
Addition rule: When you want to find the probability that one event OR another event occurs, you add the probabilities of the relevant paths together.
Checking your work:
- When you multiply probabilities, your answer must always be less than
- For any pair of branches, the probabilities must always add up to
- When you add up all possible final outcomes, they must equal
Worked example walkthrough
Worked Example: Two Bag Problem
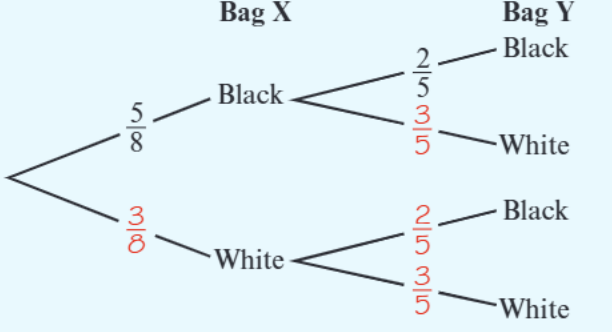
The problem: Bag X contains 5 black beads and 3 white beads. Bag Y contains 2 black beads and 3 white beads. Sara takes a bead at random from each bag.
Step 1: Set up the tree diagram
- First branches: Bag X has 5 black and 3 white beads (total 8), so and
- Second branches: Bag Y has 2 black and 3 white beads (total 5), so and
Step 2: Calculate specific probabilities
To find the probability that both beads are black:
- Follow the path: Black from Bag X, then Black from Bag Y
- Multiply along the branches:
To find the probability that both beads are the same colour:
- This can happen in two ways: both black OR both white
- Both black:
- Both white:
- Add these together:
Common exam techniques
Strategic Approaches for Exam Success
When to multiply: Use multiplication when you want events to happen in a specific sequence (this AND that).
When to add: Use addition when you want to find the probability of different ways something can happen (this OR that).
Checking your diagram: Always verify that probabilities on branches from the same point add to . This is your safety check that you've accounted for all possibilities.
Working with fractions: Keep fractions in their simplest form throughout your calculations, but don't simplify until the very end to avoid errors.
Key takeaways
Key Points to Remember:
- Tree diagrams work best with independent events where one outcome doesn't affect the next
- Probabilities on branches from the same point must always add up to
- Multiply along branches to find the probability of a specific sequence of events
- Add probabilities together when looking for different ways the same outcome can occur
- Your final answer when multiplying should always be less than , and all possible outcomes should sum to