Mean (AQA GCSE Statistics): Revision Notes
Mean
Understanding the mean formula for frequency tables
When working with discrete data organised in a frequency table, we need a special approach to calculate the mean. Unlike finding the mean of a simple list of numbers, frequency tables require us to account for how often each value occurs.

The formula for finding the mean from a frequency table is:
Breaking down the mean formula:
Let's understand what each component represents:
- (x-bar) represents the mean of all the x-values
- is the sum of all the frequency values (the total number of data items)
- is the sum of all the frequency multiplied by x-value products
- (sigma) means "the sum of"
Step-by-step method for calculating mean
To find the mean from a frequency table, follow these clear steps:
- Create an fx column - Add a third column to your frequency table labelled "f × x"
- Calculate each fx value - For each row, multiply the frequency by the x-value
- Find Σfx - Add up all the values in the fx column
- Find Σf - Add up all the frequency values (total number of items)
- Apply the formula - Divide Σfx by Σf to get your mean
This method works because we're essentially finding the total of all individual values () and dividing by the number of items ().
Worked Example: Letters in names
The table shows information about the numbers of letters in the first names of a group of 50 people. Work out the mean number of letters.
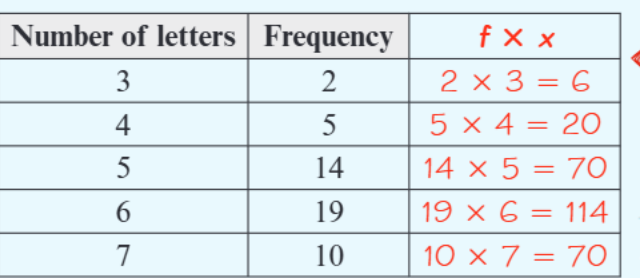
Step 1: Create the fx column by multiplying frequency by x-value:
| Number of letters | Frequency | f × x |
|---|---|---|
| 3 | 2 | 6 |
| 4 | 5 | 20 |
| 5 | 14 | 70 |
| 6 | 19 | 114 |
| 7 | 10 | 70 |
Step 2: Calculate the totals:
Step 3: Apply the formula:
Worked Example: European shoe sizes
The table gives information about European shoe sizes of 20 people.
| Shoe size | Frequency | f × x |
|---|---|---|
| 28 | 8 | 224 |
| 30 | 7 | 210 |
| 32 | 3 | 96 |
| 34 | 2 | 68 |
Solution:
Therefore:
Practice application
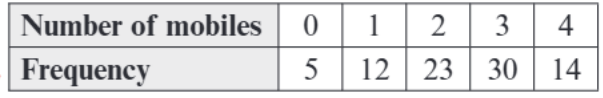
Try applying this method to real exam-style questions. For instance, if you have data about mobile phone ownership in households, you would follow the same process of creating the fx column and applying the formula.
Practice Tip
When working with any frequency table data, remember that the key is to systematically work through each step. Don't rush the multiplication stage, as this is where most errors occur.
Common mistakes to avoid:
- Forgetting to multiply by frequency - Don't just add up the x-values; you must multiply each by its frequency first
- Incorrect calculation of fx - A common mistake is writing instead of . Always check your multiplication carefully
- Using the wrong total - Make sure you divide by Σf (sum of frequencies), not by the number of different x-values
- Rounding errors - Keep your working accurate and only round your final answer as required
Exam tips:
- Always show your fx column clearly in your working
- Double-check your arithmetic, especially when adding up the fx column
- If isn't given in the question, calculate it by adding up all the frequencies
- Remember that the mean doesn't have to be one of the original x-values

Key Points to Remember:
- The mean from a frequency table uses the formula:
- Always create an fx column by multiplying frequency by x-value for each row
- is the sum of all fx values, is the sum of all frequencies
- The method accounts for how often each value occurs, not just the values themselves
- Double-check your calculations, especially the fx multiplications and final addition