Deciles and percentiles (AQA GCSE Statistics): Revision Notes
Deciles and Percentiles
Understanding deciles and percentiles is essential for analysing how data is distributed and finding specific positions within a dataset. These measures help us divide data into equal parts and locate particular values within grouped data.
What are deciles and percentiles?
Deciles are values that split your data into 10 equal parts. Think of it like dividing a group of people into 10 equally-sized queues. Each decile represents 10% of your data.
Percentiles work similarly but divide your data into 100 equal parts instead. Each percentile represents 1% of your data. You've probably heard of percentiles before - exam results are often given as percentiles to show what percentage of students scored below a particular mark.
Both deciles and percentiles are particularly useful when working with continuous data that has been grouped into intervals, and they can be found using cumulative frequency diagrams.
Finding deciles using cumulative frequency diagrams
To find any decile, you need to use this key formula:
Position of dth decile =
Where:
- = the decile number you want (1st, 2nd, 3rd, etc.)
- = total number of data values
Here's how to find a decile step-by-step:
- Calculate the position using the formula above
- Find this position on the vertical (cumulative frequency) axis of your graph
- Draw a horizontal line across to meet the curve
- Draw a vertical line down to read the value on the horizontal axis
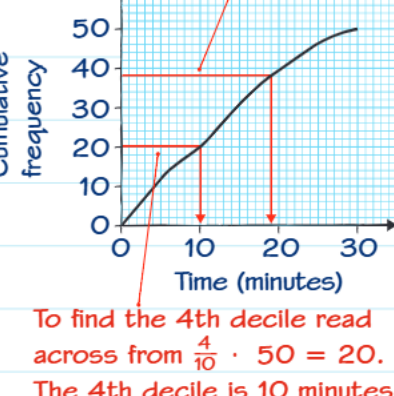
The graph above demonstrates finding the 4th decile. The calculation shows: , so we look for the 20th value on the cumulative frequency axis, which corresponds to 10 minutes.
Finding percentiles using cumulative frequency diagrams
The method for percentiles is almost identical to deciles, but uses a different formula:
Position of pth percentile =
Where:
- = the percentile number you want (1st, 2nd, 3rd, etc.)
- = total number of data values
The same four-step process applies:
- Calculate the position using
- Find this position on the cumulative frequency axis
- Draw horizontal line to the curve
- Draw vertical line down to read the value
Worked example: distances travelled to work
Let's work through a complete example using a cumulative frequency diagram showing distances 150 people travelled to work.
Worked Example: Finding Deciles and Percentiles from Cumulative Frequency
Part (a): Find the 6th decile
Step 1: Calculate position = th value Step 2: Find 90 on the cumulative frequency axis Step 3: Read across to the curve, then down to the distance axis Step 4: The 6th decile ≈ 11km
Part (b): Find the 36th percentile
Step 1: Calculate position = th value
Step 2: Find 54 on the cumulative frequency axis
Step 3: Read across to the curve, then down to the distance axis
Step 4: The 36th percentile ≈ 7km
Part (c): Find the 20th to 80th interpercentile range
First find the 80th percentile: th value ≈ 18km Then find the 20th percentile: th value ≈ 5km Interpercentile range = 18 - 5 = 13km
Working with frequency tables
Sometimes you'll need to find deciles and percentiles from frequency tables rather than graphs.

Alternative Method: Using Frequency Tables
When working with frequency tables, you would:
- Calculate the cumulative frequencies
- Find the total ( = 5 + 9 + 10 + 14 + 20 + 2 = 60)
- Use the same position formulas
- Identify which class interval contains your required position
- Use interpolation within that interval if needed
For example, to find the 20th percentile: Position = th value
Looking at cumulative frequencies: this falls in the second interval (10 < t ≤ 20), since the cumulative frequency reaches 14 by the end of this interval.
Key Formulas to Remember
- Decile position:
- Percentile position:
- Interdecile range: Higher decile value - Lower decile value
- Interpercentile range: Higher percentile value - Lower percentile value
Common Exam Tips and Traps
- Always check you're reading the correct axis when using cumulative frequency graphs
- Remember that deciles go up to the 9th decile (not 10th) and percentiles go up to the 99th percentile (not 100th)
- When asked for a range, subtract the smaller value from the larger value
- Round your final answers appropriately based on the context of the question
- Make sure you understand whether you're finding a position or an actual value
Key Points to Remember
- Deciles split data into 10 equal parts - use formula to find the position
- Percentiles split data into 100 equal parts - use formula to find the position
- Always read across then down when using cumulative frequency graphs to find actual values
- Ranges are found by subtracting the lower value from the higher value
- Check your calculations twice - position formulas are easy to mix up in exam pressure