Skewness (AQA GCSE Statistics): Revision Notes
Skewness
Skewness is a measure that describes how a distribution of data compares to a perfectly balanced, symmetrical distribution. Understanding skewness helps you interpret the shape of your data and identify whether values are bunched towards one end with a long tail stretching in the opposite direction.
You can determine skewness in two main ways: by visual inspection of data representations like box plots, or by calculating a numerical skew value using a formula.
Types of distribution
There are three main types of distribution when it comes to skewness, each with distinctive characteristics that you can identify both visually and mathematically.
Positive skew
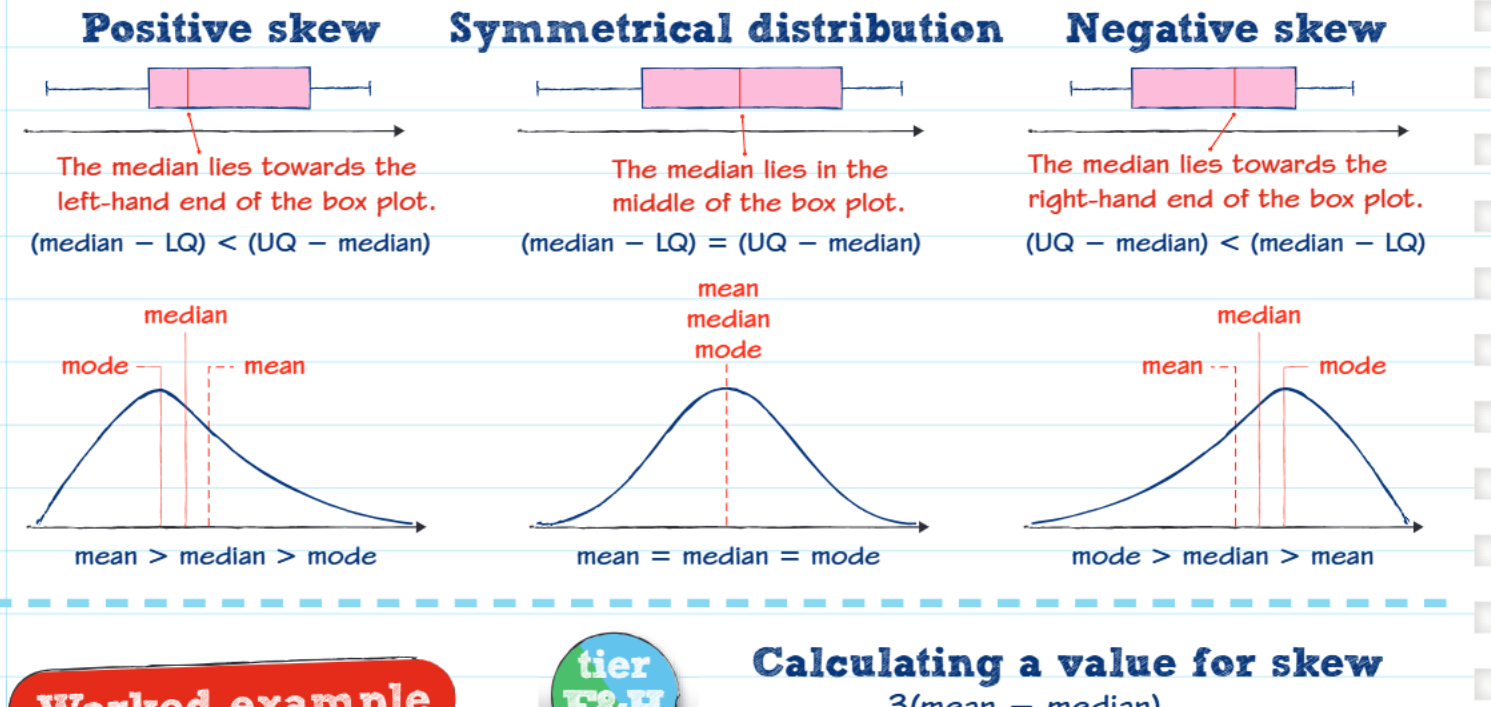
In a positively skewed distribution, most of the data values cluster towards the lower end of the range, with a long tail extending towards the higher values. This creates an asymmetrical shape where the bulk of observations sit on the left side.
When examining a box plot for positive skew, you'll notice that the median sits closer to the left-hand end of the box. Mathematically, this means that the distance from the median to the lower quartile is smaller than the distance from the median to the upper quartile: .
For the measures of central tendency in positive skew, the mean gets pulled towards the tail by the extreme high values, so it's larger than both the median and mode. The relationship follows: .
Symmetrical distribution
A symmetrical distribution shows perfect balance, with data values spread evenly on both sides of the centre. This creates the classic bell-shaped curve that you might recognise from normal distributions.
In a box plot showing symmetrical data, the median sits exactly in the middle of the box, creating equal distances to both quartiles: .
All three measures of central tendency coincide in a symmetrical distribution, giving us: .
Negative skew
Negative skew occurs when most data values bunch up towards the higher end of the range, with a long tail stretching towards the lower values. This is the mirror image of positive skew.
The box plot for negatively skewed data shows the median positioned closer to the right-hand end of the box. The mathematical relationship becomes: .
For measures of central tendency, the mean gets pulled down by the extreme low values in the tail, making it smaller than both the median and mode: .
Calculating skewness value
Beyond visual inspection, you can calculate a precise numerical value for skewness using this formula:
This formula gives you a number that tells you both the direction and strength of the skewness in your data.
Interpreting skew values
The numerical result from the skewness formula helps you understand your data distribution:
- Positive values indicate positive skew - the higher the value, the stronger the skew towards the right
- Negative values indicate negative skew - the lower the value (more negative), the stronger the skew towards the left
- Zero indicates the distribution is perfectly symmetrical
The further away from zero your calculated value is, the more pronounced the skewness in your data.
Worked example
Worked Example: Calculating Skewness Step by Step
Problem: The data shows the number of times some people used their mobile phones in one day: 2, 4, 7, 10, 0, 5, 4, 1, 12, 14, 12, 4, 18, 15, 6
Step 1: Create a box plot
First, we need to order the data and find the quartiles: 0, 1, 2, 4, 4, 4, 5, 6, 7, 10, 12, 12, 14, 15, 18
- Lower quartile (LQ) = 4
- Median = 6
- Upper quartile (UQ) = 12
Step 2: Describe the skew visually
Looking at our box plot, we can see the median (6) is closer to the lower quartile (4) than to the upper quartile (12).
Distance from median to LQ: Distance from median to UQ:
Since , we have , which indicates positive skew.
Step 3: Calculate the mean
Step 4: Calculate the skewness value
Using the standard deviation of 5.54 (given in the problem):
Step 5: Interpret the result
The skew value of 0.87 is positive, confirming our visual analysis that this data has positive skew. The value indicates a fairly strong positive skew, meaning most people used their phones relatively few times, with a few people using them much more frequently.
Key Points to Remember:
- Positive skew has the tail pointing right, with , and the median closer to the lower quartile in box plots
- Negative skew has the tail pointing left, with , and the median closer to the upper quartile in box plots
- Symmetrical distributions have and the median sits exactly in the centre of the box plot
- The skewness formula gives you a numerical measure of skewness
- Positive skew values indicate right-skewed data, negative values indicate left-skewed data, and zero indicates perfect symmetry