Grouped continuous data (AQA GCSE Statistics): Revision Notes
Grouped continuous data
When working with grouped continuous data, calculating the standard deviation requires a special approach since we don't have individual data values. Instead, we work with class intervals and frequencies, which means our result will be an estimate rather than an exact value.
Key Concept: Unlike working with individual data points, grouped continuous data calculations always produce estimates because we use mid-point values to represent entire class intervals.
Understanding the formula
For grouped continuous data, the standard deviation formula is:
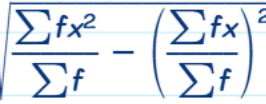
This formula might look complex, but it's essentially saying "find the square root of the mean of the squares minus the square of the mean". When dealing with grouped data, we use the mid-point of each class interval to represent all values in that group.
Setting up your calculation table
To calculate standard deviation for grouped continuous data, you need to create a table with these essential columns:

- Class intervals: The ranges of your continuous data
- Frequency (f): How many values fall in each interval
- Mid-point: The middle value of each class interval
- fD: Frequency multiplied by the mid-point
- fD²: Frequency multiplied by the mid-point squared
Why Mid-points Matter: The mid-point represents the typical value for all data in that class interval, which is why our final answer is an estimate. We assume all values in each class are concentrated at the mid-point.
Step-by-step calculation process
Systematic Approach: Here's how to work through the calculation systematically:
- Find the mid-point of each class interval
- Calculate fD for each row (frequency × mid-point)
- Calculate fD² for each row (frequency × mid-point²)
- Sum all columns: Find , , and
- Calculate the mean: Mean =
- Apply the standard deviation formula
Worked example: Bird flight distances
Worked Example: Calculating Standard Deviation for Bird Flight Distances
Let's work through a complete example using data about distances that birds flew from their nests.
Given data:
- Distance intervals from 0m to 100m in 20m groups
- Total of 60 birds observed
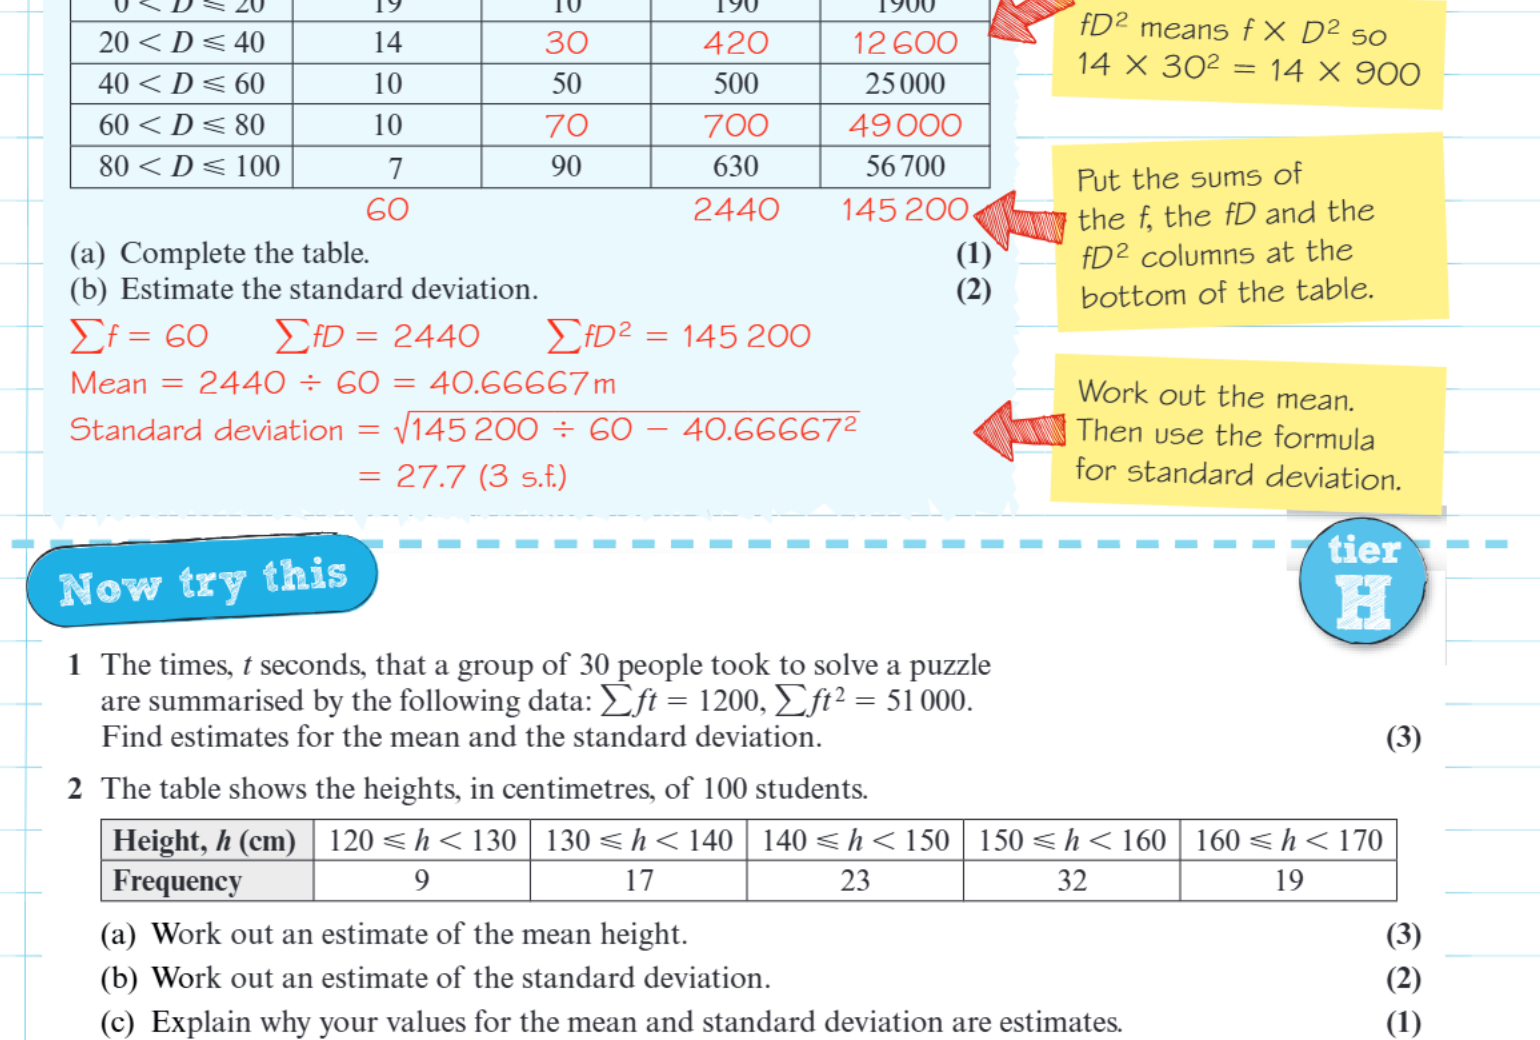
Step 1: Complete the table
| Distance, D (m) | Frequency, f | Mid D | fD | fD² |
|---|---|---|---|---|
| 0 < D ≤ 20 | 19 | 10 | 190 | 1900 |
| 20 < D ≤ 40 | 14 | 30 | 420 | 12600 |
| 40 < D ≤ 60 | 10 | 50 | 500 | 25000 |
| 60 < D ≤ 80 | 10 | 70 | 700 | 49000 |
| 80 < D ≤ 100 | 7 | 90 | 630 | 56700 |
| Totals | 60 | 2440 | 145200 |
Step 2: Calculate the totals
Step 3: Find the mean
Step 4: Calculate standard deviation
Important points to remember
Why this gives an estimate: Since we're using the mid-point to represent all values in each class interval, we're making an assumption about where the actual data points lie within each group. The real data could be spread differently within each interval.
Accuracy considerations: The estimate will be more accurate when:
- Class intervals are relatively narrow
- Data is fairly evenly distributed within each interval
- You have a reasonable number of data points
Common exam tips:
- Always show your working clearly with the three key totals: , ,
- Remember to square the mid-point value when calculating
- Don't forget the square root in the final step
- Round sensibly to an appropriate number of significant figures
Remember!
Key Points to Remember:
- The formula for grouped continuous data standard deviation is
- You need three key columns in your table: , , and
- Always use the mid-point of each class interval in your calculations
- Your answer will be an estimate, not an exact value
- Sum your columns carefully and double-check your arithmetic before applying the formula