Simultaneous Equations and Graphs (Edexcel GCSE Maths): Revision Notes
Simultaneous equations and graphs
Using graphs to solve simultaneous equations
The graphical method provides a visual way to solve simultaneous equations. Instead of using algebraic manipulation, you can plot both equations as graphs and find where they intersect. The coordinates of the intersection point(s) give you the solution to the system of equations.
This approach works because the solution to simultaneous equations is the set of values that satisfy both equations at the same time. Graphically, this means finding the point(s) where both graphs meet.
The graphical method is particularly useful because it gives you a visual representation of the solution, making it easier to understand what's happening mathematically. This visual approach can also help you estimate solutions even before you read the exact coordinates.
The basic graphical method
The process involves two main steps: first, draw both graphs accurately on the same coordinate system, then identify where the graphs cross each other. The intersection points represent the solutions to your simultaneous equations.
Worked Example: Two linear equations
When solving linear simultaneous equations like and , you'll be working with two straight lines that intersect at exactly one point.
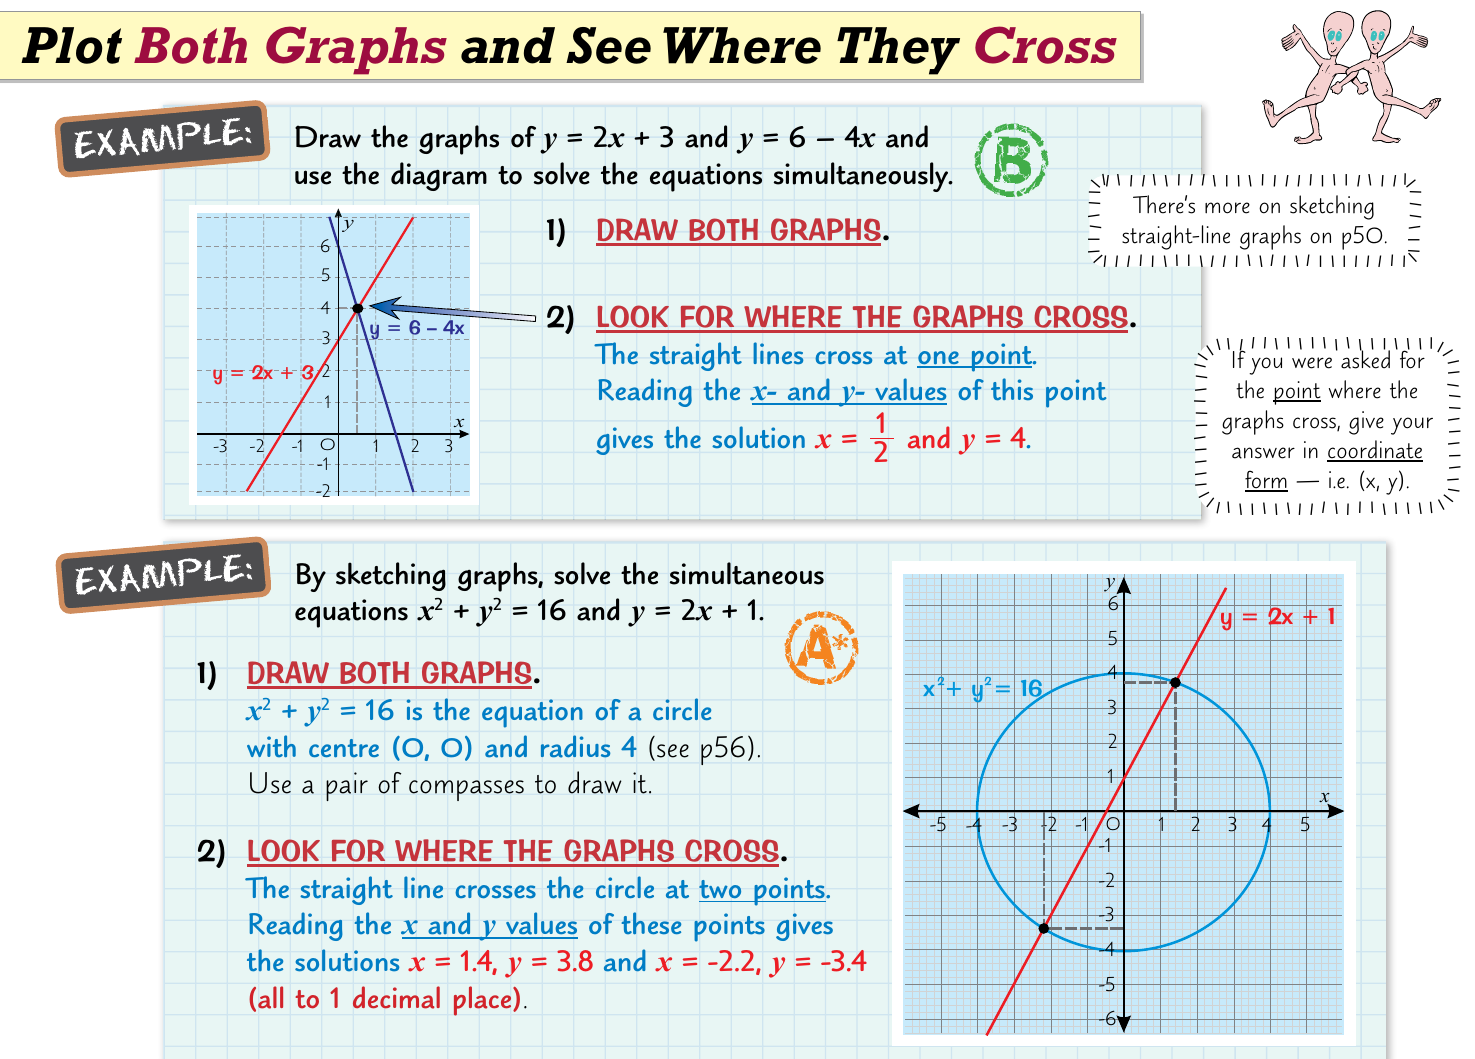
Step 1: Plot both lines on the same coordinate grid
- The first equation, , represents a line with gradient 2 and y-intercept 3
- The second equation, , can be rewritten as , showing a line with gradient -4 and y-intercept 6
Step 2: Find the intersection point When you draw both lines carefully, you'll see they cross at the point where and .
Solution: ,
Worked Example: Linear-quadratic systems
Sometimes you'll encounter a system where one equation is linear and the other is quadratic. For instance, when solving and , you're working with a circle and a straight line.
Step 1: Identify the shapes
- The equation represents a circle with its centre at the origin and radius 4
- The equation represents a straight line with gradient 2 and y-intercept 1
Step 2: Plot and find intersections When you plot both graphs, the line intersects the circle at two points.
Solutions: , and , (rounded to 1 decimal place)
Advanced technique: Using given graphs
Sometimes you'll be given one graph and asked to determine what line to draw to solve a particular equation. This requires rearranging the equation to identify the second graph needed.
The key insight is that you need to rearrange the equation so that one side matches the given graph. This allows you to determine what additional line or curve needs to be drawn to find the intersection points.
Worked Example: Working with quadratic equations
Consider the situation where you have the graph of and need to solve .
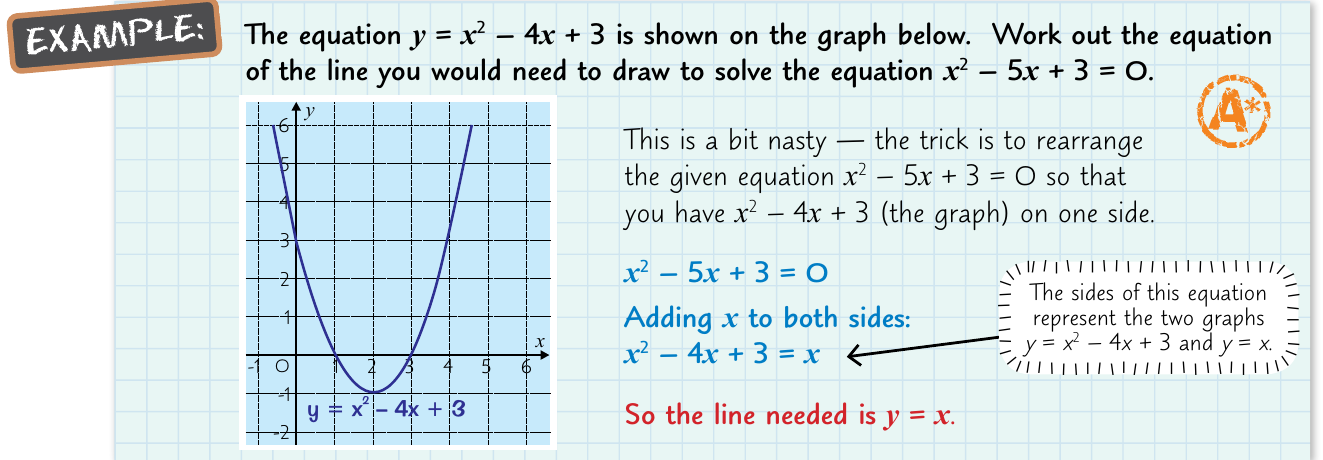
Step 1: Rearrange the equation Starting with , you can add to both sides to get .
Step 2: Identify what to draw This means you're looking for points where the parabola equals the line .
Step 3: Find the solution By drawing the line on the same graph as the given parabola, the intersection points will give you the solutions to the original equation .
Key tips for success
When using the graphical method, accuracy in plotting is crucial. Use graph paper and plot several points for each equation to ensure your graphs are drawn correctly. Pay particular attention to the scale on your axes and make sure you can read coordinates accurately.
For linear equations, you only need two points to draw the line, but plotting a third point as a check is always wise. For quadratic equations, plot several points around the vertex to capture the curve's shape accurately.
Remember that the intersection points represent the exact solutions to your simultaneous equations. If you're asked to give answers in coordinate form, write them as rather than stating and separately.
Common mistakes to avoid:
- Inaccurate plotting leading to wrong intersection points
- Forgetting to check your scale when reading coordinates
- Not drawing both graphs on the same coordinate system
- Misreading negative coordinates at intersection points
Key Points to Remember:
- The graphical method involves plotting both equations and finding where they cross
- Linear equations produce straight lines that typically intersect at one point
- Linear-quadratic systems often have two solutions where the line crosses the curve
- Always draw both graphs accurately before looking for intersection points
- The coordinates of intersection points are the solutions to your simultaneous equations
- When given one graph, rearrange equations to determine what additional line or curve to draw