Averages and Spread (Edexcel GCSE Maths): Revision Notes
Averages and spread
Understanding measures of spread
When you're looking at a set of data, averages tell you about the centre of the data, but measures of spread tell you how the data is distributed around that centre. Think of spread as describing how "scattered" or "bunched together" your data points are.
The range gives you the overall spread by showing the difference between the highest and lowest values. However, the interquartile range is often more useful because it focuses on the spread of the middle portion of your data, which isn't affected by extreme values.
Understanding spread is crucial for interpreting data properly. Two datasets can have the same average but completely different spreads, which tells you very different stories about the data.
What are quartiles?
Quartiles are special values that divide your data into four equal groups, each containing 25% of the data points. This makes them incredibly useful for understanding how your data is distributed.
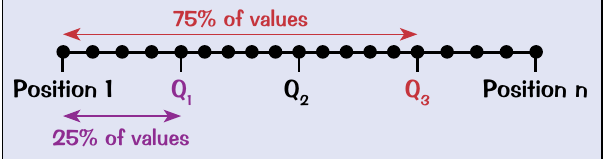
There are three quartiles you need to know:
- Lower quartile (Q1): The value that's 25% of the way through your ordered data
- Median (Q2): The middle value, which is 50% of the way through your data
- Upper quartile (Q3): The value that's 75% of the way through your ordered data
When you arrange your data in ascending order, these quartiles mark the boundaries between the four equal groups. The first quarter contains the bottom 25% of values, the second quarter contains the next 25%, and so on.
Critical Step: Always arrange your data in ascending order before calculating quartiles. This is essential for the quartile formulas to work correctly.
Calculating quartiles
To find quartiles, you need to work out the position of each quartile in your ordered data set.
Quartile Position Formulas:
- Q1 position = (n + 1) ÷ 4
- Q2 position = 2(n + 1) ÷ 4
- Q3 position = 3(n + 1) ÷ 4
Where n is the total number of data values.
Remember: These formulas give you the position of the quartile, not its value!
Worked Example: Finding Quartiles
Let's work through an example with the ages of fine cheeses: 7, 12, 5, 4, 3, 9, 5, 11, 6, 5, 7
Step 1: Put the data in ascending order 3, 4, 5, 5, 5, 6, 7, 7, 9, 11, 12
Step 2: Count the values (n = 11)
Step 3: Find Q1 position = (11 + 1) ÷ 4 = 3 So Q1 is the 3rd value = 5
Step 4: Find Q3 position = 3(11 + 1) ÷ 4 = 9
So Q3 is the 9th value = 9
Step 5: Calculate the interquartile range IQR = Q3 - Q1 = 9 - 5 = 4
Interquartile range (IQR)
The interquartile range is the difference between the upper quartile and the lower quartile. It tells you about the spread of the middle 50% of your data values.
The IQR is particularly useful because it's not affected by extreme values (outliers) in your data. While the range might give you a misleading impression if you have one very high or very low value, the IQR focuses on where most of your data lies.
The IQR is considered a more robust measure of spread than the range because it ignores the extreme values that might skew your understanding of the data distribution.
Working with stem and leaf diagrams
Stem and leaf diagrams are brilliant for displaying data in a way that makes it easy to find quartiles and other measures. They show all your data values while keeping them in order.
Constructing a stem and leaf diagram
Stem and leaf diagrams provide a visual way to organise data that makes calculating measures much easier.
Worked Example: Constructing a Stem and Leaf Diagram
Let's say you have dog agility test scores: 26, 16, 29, 7, 12, 32, 29, 24, 13, 17, 20, 23, 24, 31, 34
Step 1: Put the data in ascending order 7, 12, 13, 16, 17, 20, 23, 24, 24, 26, 29, 29, 31, 32, 34
Step 2: Group by the tens digit (the "stem")
- 0: 7
- 1: 2, 3, 6, 7
- 2: 0, 3, 4, 4, 6, 9, 9
- 3: 1, 2, 4
Step 3: Always include a key Key: 2|3 = 23
Reading measures from stem and leaf diagrams
Once you have your stem and leaf diagram, finding the median and range becomes straightforward:
For the median: With n = 15, the median position is (15 + 1) ÷ 2 = 8 Count to the 8th value in your diagram to find the median = 24
For the range: Simply subtract the lowest value from the highest value Range = 34 - 7 = 27
The ordered nature of stem and leaf diagrams makes them perfect for quickly identifying quartiles and calculating the interquartile range.
Key Points to Remember:
- Quartiles divide your data into four equal groups of 25% each
- Use the formulas (n + 1)/4, 2(n + 1)/4, and 3(n + 1)/4 to find quartile positions
- The interquartile range (IQR = Q3 - Q1) measures the spread of the middle 50% of data
- Always put your data in ascending order before calculating quartiles
- Stem and leaf diagrams make it easier to read off quartiles and other measures because they display data in order