Scientific Data (Leaving Cert Biology): Revision Notes
Scientific Data
Types of scientific data
When conducting scientific investigations, we collect different types of data depending on what we're measuring or observing. Understanding these types helps us choose the right methods for analysis and presentation.
Qualitative data describes characteristics or qualities that cannot be measured with numbers. This type of data focuses on describing something using words rather than numerical values. Examples include the colour of a solution during a chemical reaction, the texture of a plant leaf, or the behaviour of an organism in its habitat.
Quantitative data involves numerical measurements that can be counted or measured precisely. This data can be analysed using mathematical and statistical methods. Examples include the temperature of a solution, the number of organisms in a population, or the mass of a substance.
Data Type Example: Pulse Rates
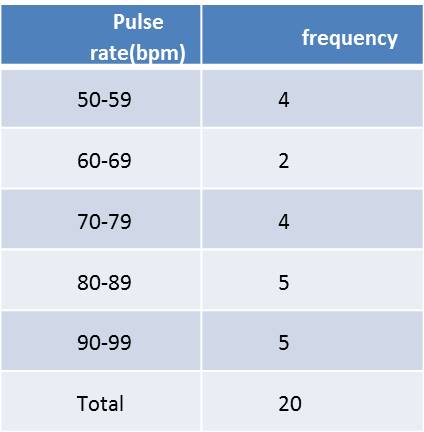
The table above shows quantitative data tracking pulse rates in a group of people. Notice how each data point has a specific numerical value that can be compared and analysed statistically. This demonstrates how quantitative data allows for precise mathematical analysis and trend identification.
Qualitative data tends to be harder to analyse statistically because it often involves subjective interpretations and personal judgements. For example, describing when a solution changes colour requires human observation and interpretation. Quantitative data is generally considered more reliable and objective since it's based on precise measurements that can be repeated and verified.
Data collection principles
Equipment selection plays a crucial role in obtaining reliable data. When designing experiments, scientists must consider factors like accuracy, precision, and safety. For instance, when measuring small masses, it's better to use a balance that weighs to the nearest 0.01g rather than 1g for more precise results.
Scientific integrity means following all the rules and values that govern how we conduct, report, and apply scientific research. This principle ensures that scientific reports are clear, unbiased, and can be repeated by other researchers. When scientists maintain integrity, they build trust in the scientific community and ensure that science advances based on solid foundations.
Scientific integrity is essential for maintaining trust in research. When scientists maintain integrity, they build trust in the scientific community and ensure that science advances based on solid foundations.
Reliability of data
Understanding reliability helps us determine how trustworthy our results are and whether other scientists can depend on our findings.
Repeatability occurs when the same person or research team gets very similar results using identical equipment and methods. This shows that the experimental method is consistent and the measurements are precise. For example, if you measure the temperature of water three times with the same thermometer and get readings of 25.1°C, 25.2°C, and 25.1°C, your results show good repeatability.
Reproducibility happens when different people or research groups obtain similar results using different equipment or slightly different methods. This demonstrates that the findings are robust and not dependent on specific conditions or equipment. Reproducible results carry more authority in the scientific community because they show the findings can be replicated independently.
If results cannot be repeated or reproduced, scientists must question their methods and equipment, and consider whether their findings are reliable enough to trust.
Analysing scientific data
Identifying patterns in data helps us predict what might happen in future investigations. Data often reveals trends or relationships that weren't immediately obvious. When data is presented in graphs or tables, patterns become easier to spot than when looking at raw numbers.
Looking at the fertility data example, we can identify a clear pattern showing that the average number of babies born per female has steadily decreased from 1965 to 2015. This downward trend helps researchers predict that fertility rates might continue declining in following years.
Anomalous results are data points that don't fit the expected pattern formed by other results. These outliers might occur due to human error, faulty equipment, poorly controlled variables, or other factors that affected that particular measurement.
When you encounter anomalous results, you should first try to repeat the experiment if possible. If repetition isn't feasible, you should account for the anomaly in your analysis. Sometimes anomalous results can be ignored in your conclusions, but you should always acknowledge them in your written work rather than pretending they don't exist.
Understanding relationships in data
Scientists often investigate whether two variables are connected, but it's crucial to understand the difference between correlation and causation.
Correlation means there's a statistical association or connection between two variables. When one variable changes, the other tends to change in a predictable way. However, correlation doesn't necessarily mean that one variable directly causes changes in the other.
Causation means that changes in one variable directly result in changes in another variable. This represents a true cause-and-effect relationship where one factor actually influences the other.
Understanding Correlation vs Causation: Dog Ownership
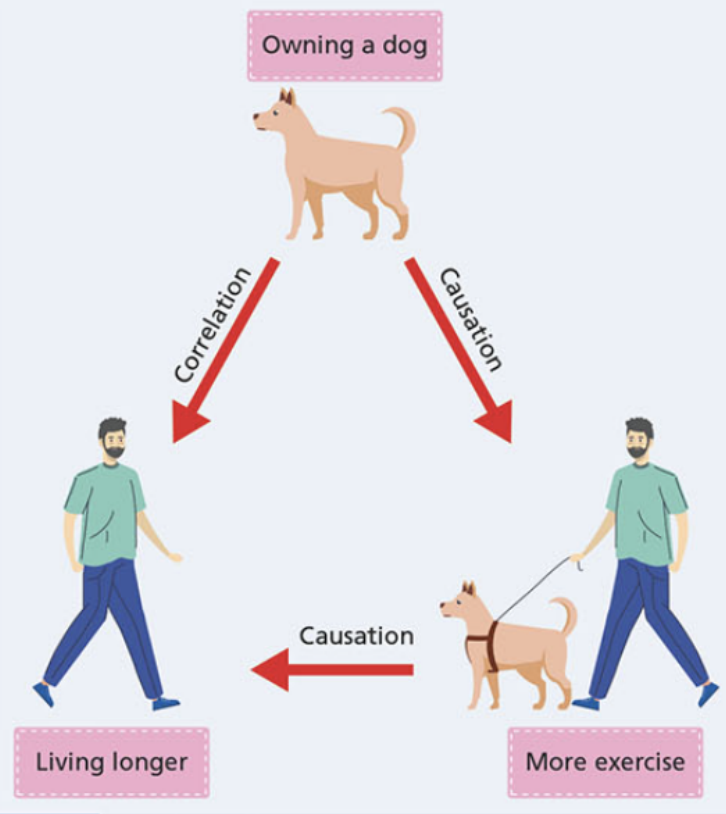
The diagram above illustrates this important distinction using dog ownership as an example. There's a correlation between owning a dog and living longer, but the dog ownership doesn't directly cause longer life. Instead, the causation works through increased exercise - dog owners tend to walk more, which leads to better health and longer life.
Common Mistake to Avoid: Never assume that correlation implies causation. To establish causation rather than just correlation, scientists often conduct controlled experiments where they can manipulate variables and observe direct effects. This helps avoid drawing incorrect conclusions from data that only shows correlation.
Drawing conclusions from data
A conclusion summarises the key findings from your investigation and explains what you've learned. Good conclusions should be brief and directly address the original research question or hypothesis.
Effective conclusions typically:
- State the main findings clearly
- Explain whether your hypothesis was supported or not
- Note any limitations or uncertainties in your results
- Suggest what future investigations might explore
- Avoid introducing completely new information
Your conclusions should be supported by the evidence you've collected. Avoid making claims that go beyond what your data actually shows, and be honest about any limitations or errors that might affect your interpretation.
Communicating scientific results
Scientists must share their findings with different audiences, from fellow researchers to students and the general public. The way you present your results depends on your audience's background knowledge and interests.
When communicating scientific results:
- Adapt your language to suit your audience - use technical terms with scientists but simpler language with students
- Be precise about what you measured and found
- Include visual aids like graphs, charts, or diagrams to make complex data easier to understand
- Follow the scientific process - explain your methods, present results clearly, and discuss what they mean
- Avoid jargon when writing for non-scientific audiences, or explain technical terms when you must use them
Clear communication ensures that scientific knowledge can be understood, verified, and built upon by others in the scientific community.
Key Points to Remember:
-
Qualitative data describes characteristics in words, while quantitative data uses numerical measurements that can be analysed statistically
-
Repeatability means getting similar results under identical conditions, while reproducibility means getting similar results under different conditions - both are essential for reliable science
-
Correlation shows an association between variables, but causation shows that one variable directly causes changes in another - don't assume correlation means causation
-
Anomalous results that don't fit the pattern should be acknowledged and explained rather than ignored in your analysis
-
Good conclusions summarise your main findings clearly and relate back to your original research question without making claims beyond what your data supports