The Budget, Revenue, and Expenditure (HSC SSCE Economics): Revision Notes
The Budget, Revenue, and Expenditure
Understanding fiscal policy
Fiscal policy is the Australian Government's key macroeconomic tool for managing the economy. It works by using taxation and spending powers to achieve specific economic goals, including:
- Stabilising economic activity levels
- Maintaining low inflation
- Reducing unemployment
- Redistributing income across society
- Shaping Australia's position in the global economy
The government implements fiscal policy through the Commonwealth Budget, which is presented to Parliament each May. This official document outlines planned revenue collection and spending for the upcoming financial year. By adjusting expenditure (G) and revenue (T), the government can influence overall economic activity and impact both inflation and unemployment levels.
The Commonwealth Budget is Australia's most important economic policy document. It not only sets out the government's financial plans but also signals policy priorities and economic direction for the entire year ahead.
Commonwealth Government revenue
Revenue forms the income side of the budget equation. In 2019-20, the Commonwealth Government budgeted to collect $514 billion in revenue. Taxation provides 93% of this total, with the remaining 7% coming from non-tax sources.
Understanding the distinction between direct and indirect taxes is crucial. Direct taxes (like income tax) are paid directly by individuals and businesses to the government. Indirect taxes (like GST) are collected through the price of goods and services.
Income tax
Income tax represents the largest single revenue source, accounting for 68% of total government income. This tax applies to earnings received by both individuals and businesses.
Personal income tax generates almost 46% of Commonwealth revenue. Under the Pay-As-You-Go (PAYG) system, tax is automatically deducted from wages and salaries before workers receive their pay. Self-employed individuals and those earning substantial investment income also pay through this system.
A defining characteristic of personal income tax is its progressive structure. This means higher income earners pay proportionally more tax than those on lower incomes. For example, someone earning $200,000 annually pays a higher percentage of their income in tax compared to someone earning $50,000. This progressive structure helps redistribute income across society.
Understanding Progressive Taxation
Consider two taxpayers:
- Person A earns $50,000 and pays $7,000 in tax (14% effective rate)
- Person B earns $200,000 and pays $60,000 in tax (30% effective rate)
Even though Person B earns four times more income, they pay more than eight times as much tax. This demonstrates how the progressive system ensures higher earners contribute proportionally more to government revenue, supporting income redistribution across society.
Company tax contributes nearly 20% of government revenue. Corporations pay a flat rate of 30% on their net profits before distributing any funds to shareholders. Smaller businesses with annual turnover below $50 million benefit from a reduced rate of 27.5%.
Additional income tax revenue comes from:
- Fringe benefits tax (around 1% of revenue) – paid by businesses on non-cash benefits provided to employees, such as company vehicles or entertainment expenses
- Superannuation tax (approximately 2% of revenue) – collected on retirement savings contributions, with this proportion growing as Australia's superannuation system matures
Goods and Services Tax (GST)
The GST is Australia's primary indirect tax, applied at a flat rate of 10% on most goods and services sold domestically. Basic food items are exempt from GST. Although the Commonwealth Government collects GST revenue (making up about 14% of total tax collection), these funds are automatically transferred to state and territory governments to fund their operations.
The GST is called an indirect tax because consumers don't pay it directly to the government. Instead, businesses collect it as part of the sale price and then remit it to the Australian Taxation Office. This makes collection more efficient than having millions of individual consumers pay directly.
Excise and customs duties
These taxes are levied on the quantity of specific products, contributing around 9% of government revenue. The main products subject to these duties include petrol, diesel, tobacco, and alcohol.
The government strategically applies excise duties to goods with inelastic demand – products that consumers continue purchasing even when prices rise. Because demand for these items remains relatively stable despite price increases, the government can collect substantial revenue without significantly reducing consumption. For example, while cigarette prices have increased dramatically due to excise duties, many smokers continue purchasing tobacco products, ensuring continued tax revenue.
Why Inelastic Demand Matters for Tax Revenue
Goods with inelastic demand are ideal targets for excise duties because:
- Consumers continue buying them despite higher prices
- Tax revenue remains stable and predictable
- The government can raise substantial funds without dramatically reducing consumption
- These taxes also serve a secondary purpose of discouraging consumption of harmful products like tobacco and alcohol
Other tax revenue
This miscellaneous category accounts for 2% of government revenue and includes various taxes, charges, fees, and fines. Examples include fees for Australian passports, visa charges, and administrative fines.
Non-tax revenue
The smallest revenue category (7% of total income) includes:
- Profits from government-owned enterprises
- Interest earned on government investments
- Dividends from government shareholdings
- Royalties paid to the government for resource extraction
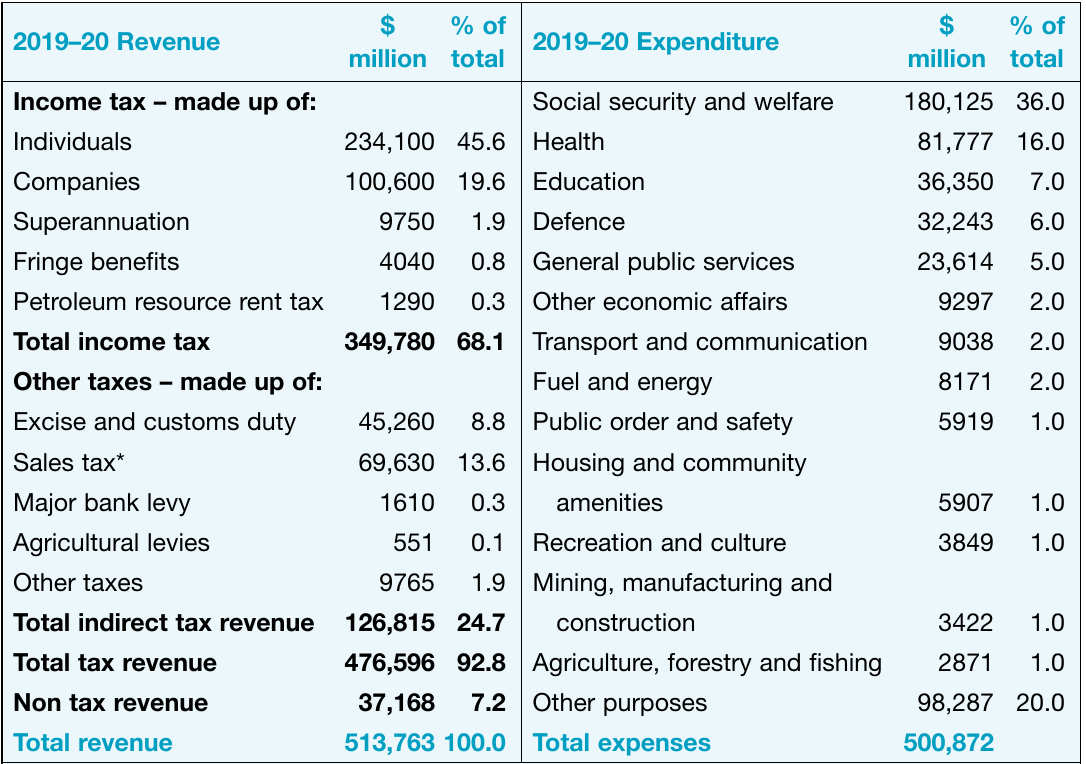
The table above shows the complete breakdown of government revenue and expenditure for 2019-20, illustrating the relative importance of different revenue sources and spending priorities. Notice how income tax dominates the revenue side, while social security and welfare dominate expenditure.
Commonwealth Government expenditure
The expenditure side of the budget reveals government priorities and responsibilities. For 2019-20, planned expenditure totalled $501 billion. This spending serves multiple purposes: providing essential services, investing in infrastructure, supporting those in need, and pursuing broader economic and social objectives.
Social security and welfare
This category represents the largest government outlay at 36% of total expenditure ($180 billion). These funds represent transfer payments – money transferred from taxpayers to welfare recipients to redistribute income across society.
Transfer payments support various groups including:
- Age pensioners
- Unemployed individuals (through JobSeeker payments)
- Families with children (via Family Tax Benefits)
- People with disabilities
- Carers
Unlike spending on goods and services, transfer payments don't directly purchase anything. Instead, they provide purchasing power to recipients, who then spend the money in the economy. This means transfer payments have a multiplier effect as recipients use the funds to buy goods and services from businesses.
Health expenditure
Health spending accounts for 16% of the budget ($82 billion). While state and territory governments primarily deliver healthcare services through public hospitals, the Commonwealth Government funds several major programs:
- Medicare – Australia's universal healthcare system providing subsidised or free medical services
- Pharmaceutical Benefits Scheme (PBS) – making prescription medications affordable
- Public hospital funding – contributing to state-run hospital operations
Education funding
Education receives 7% of government spending ($36 billion). Commonwealth funding supports:
- Universities and higher education institutions
- Vocational education and training (VET) providers
- Government and non-government primary and secondary schools (though states have primary responsibility for school education)
This investment aims to develop Australia's human capital, improve workforce productivity, and provide opportunities for social mobility.
Defence
Defence spending (6% of the budget, $32 billion) covers:
- Military personnel salaries and training
- Defence equipment and technology
- Military operations and deployments
- Defence infrastructure
Infrastructure and social overhead capital
Infrastructure spending (appearing across several budget categories) funds essential facilities including:
- Roads and highways
- Rail networks
- Ports and airports
- Communications networks
Economists call these investments social overhead capital because they provide the foundation for economic activity. Quality infrastructure reduces business costs, improves productivity, and enhances living standards.
Infrastructure spending creates both short-term and long-term benefits. In the short term, it provides employment and stimulates economic activity during construction. In the long term, it improves productivity and reduces business costs, supporting sustained economic growth.
Environmental protection
Environmental spending represents a smaller budget category but addresses critical sustainability challenges. This includes:
- Clean energy and renewable technology investment
- Low carbon emission technologies
- Energy efficiency programs
- Water resource management
These investments support ecologically sustainable development – economic growth that doesn't compromise environmental quality for future generations.
Other expenditure categories
Remaining spending covers:
- General public services (5%)
- Transport and communication (2%)
- Fuel and energy (2%)
- Public order and safety (1%)
- Housing and community amenities (1%)
- Recreation and culture (1%)
- Primary industries support (1%)
- Other purposes (20%)
The budget as a policy tool
The Commonwealth Budget serves as more than just an accounting document. By adjusting revenue and expenditure levels, the government can:
- Influence aggregate demand – Increased spending or reduced taxation injects money into the economy, stimulating demand. Conversely, spending cuts or tax increases reduce demand.
- Redistribute income – Progressive taxation and transfer payments shift resources from higher to lower income groups, reducing inequality.
- Allocate resources – Government spending directs resources toward areas the market might underprovide, such as defence, public education, and infrastructure.
- Address market failures – Environmental spending and regulation correct market failures where private markets fail to account for social costs.
Understanding Fiscal Policy Stance
The budget's impact on the economy depends on whether policy is:
- Expansionary – Increased spending or reduced taxes stimulate economic activity, useful during recessions
- Contractionary – Decreased spending or increased taxes slow economic activity, useful when inflation is high
Always consider the budget stance when analysing economic conditions and policy responses.
Exam guidance
When analysing budget policy:
- Always distinguish between revenue and expenditure measures
- Explain the impact of changes, not just what they are
- Consider both efficiency and equity effects
- Link budget measures to macroeconomic objectives (growth, inflation, unemployment)
- Evaluate whether fiscal policy stance is expansionary (stimulating economy) or contractionary (slowing economy)
Common Command Words in Exam Questions
- Outline: Present main features without detailed explanation
- Explain: Show cause-and-effect relationships
- Analyse: Break down into components and examine relationships
- Evaluate: Make judgements supported by evidence about effectiveness
Understanding what each command word requires will help you structure answers appropriately and earn maximum marks.
Key Points to Remember:
- Fiscal policy uses government taxation and spending to achieve economic objectives like stable growth, low inflation, and reduced unemployment
- 93% of government revenue comes from taxation, with income tax (68%) being the dominant source
- Personal income tax is progressive – higher earners pay proportionally more, supporting income redistribution
- GST revenue (14% of collections) is passed entirely to state and territory governments
- Excise duties work effectively on goods with inelastic demand (petrol, tobacco, alcohol) because consumers continue purchasing despite price increases
- Social security and welfare is the largest spending category (36%), consisting of transfer payments that redistribute income
- The top three spending areas are social security (36%), health (16%), and education (7%)
- The budget is presented annually in May and serves as the primary tool for implementing fiscal policy
- Transfer payments don't directly purchase goods or services but provide purchasing power to recipients
- Social overhead capital (infrastructure) provides the foundation for economic activity and long-term growth