The Public Sector (HSC SSCE Economics): Revision Notes
The Public Sector
What is the public sector?
The public sector encompasses all parts of the economy owned or controlled by government. This includes:
- All three levels of government (Commonwealth/federal, state, and local councils)
- Government business enterprises (GBEs) such as Australia Post, Sydney Water Corporation, and RailCorp
Understanding the public sector's size and role is essential for analysing how government influences economic activity and resource allocation in Australia.
Government Business Enterprises (GBEs) are commercial organizations owned by government but operating in competitive markets. They combine public ownership with private-sector business practices, providing essential services while generating revenue.
Measuring the size of the public sector
Economists use two main indicators to assess how large the public sector is relative to the whole economy.
Public sector outlays as a percentage of GDP
This measure shows what proportion of total economic spending comes from government at all levels. It includes spending by Commonwealth, state and local governments, plus their business enterprises.
The data reveals significant changes over time. In the early post-war period (1949-50), government spending represented just 19.9% of GDP. This grew substantially through the second half of the twentieth century, reaching 40.5% by 1999-2000.
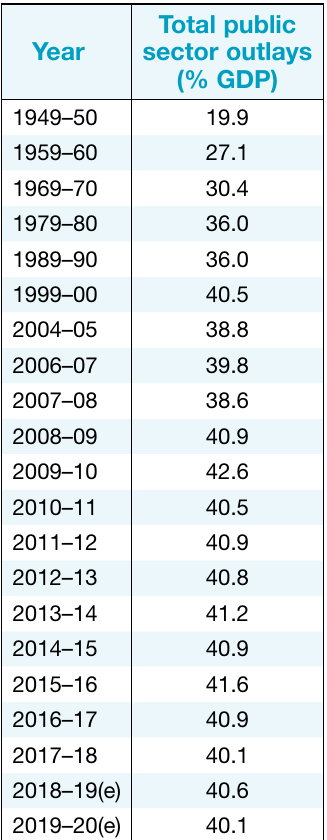
21st Century Stabilisation
In the twenty-first century, public sector outlays have stabilised within a range of 39% to 43% of GDP. The highest point occurred in 2009-10 (42.6%) during the Global Financial Crisis, when the government increased spending dramatically to support the economy. Most recently, the figure sits around 40% of GDP.
International Comparison
Australia's public sector is relatively small compared to many other advanced economies, particularly those in Europe where government spending typically exceeds 45% of GDP. This reflects Australia's preference for market-based solutions and lower taxation levels.
Public sector employment as a percentage of total employment
This indicator measures what proportion of Australia's workforce is employed directly by government.
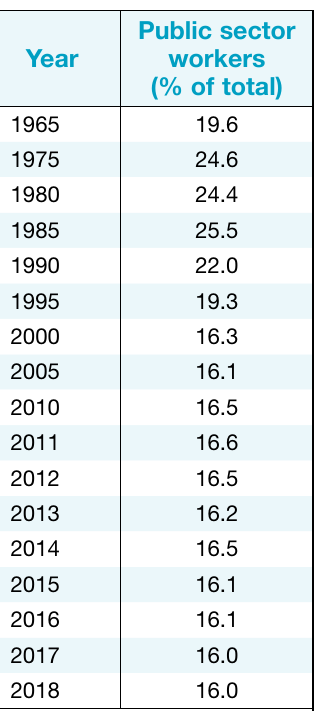
Public sector employment followed a similar growth pattern to spending, rising from 19.6% in 1965 to a peak of 25.5% in 1985. However, employment has since declined significantly, stabilising at approximately 16% of the workforce since 2000.
This reduction reflects two key policy shifts:
Privatisation: During the 1980s and 1990s, governments sold many public enterprises to private owners. Examples include Commonwealth Bank, Qantas, and state-owned electricity generators. This transferred thousands of workers from public to private sector employment.
Contracting out: Governments increasingly hire private sector firms to deliver services rather than employing staff directly. Activities like road construction, IT services, and job placement assistance are now often performed by private contractors working for government. These workers appear in private sector employment statistics despite providing government services.
Trends in the composition of government spending
While overall spending levels have stabilised, the mix of what government spends money on has shifted considerably.
Infrastructure vs welfare spending
Governments now allocate:
- Less on physical infrastructure (roads, buildings, public facilities)
- More on social welfare payments and community services like health care
Transfer Payments: The Largest Spending Category
Transfer payments represent the largest single category of Commonwealth expenditure, accounting for approximately one-third of total spending. These are payments redistributed to households rather than spent on goods and services.
Examples of Transfer Payments:
Unlike direct government purchases, transfer payments don't directly employ resources but redistribute income between groups in society. Common examples include:
- Age pensions - Regular payments to eligible retirees
- Unemployment benefits - Support for job seekers
- Family tax benefits - Assistance for families with children
- Disability support payments - Income support for people with disabilities
Why the public sector expanded after World War II
The influence of Keynesian economics
Between the 1940s and 1970s, governments in industrialised countries adopted more active economic management, influenced by Keynesian economic theory. This school of thought argued that:
- Government spending could stimulate economic activity
- Active fiscal policy could help achieve full employment
- Counter-cyclical spending could smooth out economic fluctuations
This led to substantial growth in government budgets and employment as public sectors took on more responsibility for economic management.
The shift away from intervention (1980s-1990s)
By the 1980s, Keynesian policies lost favour as governments faced:
- Spending growing faster than revenue
- Rising government debt from borrowing
- High taxation levels
Policy Response to Fiscal Pressures
Governments responded by fundamentally restructuring the public sector:
- Reducing spending and taxation
- Privatising government businesses
- Contracting out services to the private sector
These reforms permanently changed the relationship between government and the economy, reducing direct public sector involvement while maintaining service provision through alternative mechanisms.
The return of intervention after the Global Financial Crisis
Keynesian-style intervention returned to prominence following the 2008 GFC. Governments worldwide, including Australia, responded with:
- Large short-term increases in government spending
- Increased borrowing to fund stimulus measures
- Support for financial institutions at risk of collapse
- Policies to stabilise the business cycle
In Australia, this rapid fiscal response helped the economy avoid recession. However, spending cuts in subsequent years combined with slow revenue recovery left persistent budget deficits throughout the 2010s.
Growing expectations for government services
Despite efforts to constrain spending, public expectations of government have continued to expand as living standards have risen.
Citizens now expect government to provide:
Universal services: Police, water and sewerage systems, roads, recreational facilities, accessible to all regardless of income
High-quality essential services: World-class health care and education systems that meet rising standards
Modern service delivery: Online, individualised, efficient interactions with government agencies
Environmental management: Solutions to problems like congestion, pollution, and resource depletion caused by economic growth
The Spending Pressure Paradox
These expectations create ongoing pressure for government spending even as policymakers try to limit the public sector's size. This tension between public demand for services and political commitments to fiscal restraint remains a central challenge in Australian public policy.
The growth of social security programs
Social security has been a major driver of public sector expansion.
Early development (1901-1950)
Australia's first Commonwealth governments following Federation in 1901 prioritised welfare programs. Before these measures, people relied on charity. Early programs included:
- Age pension
- Widows' pensions
- Child support payments
- Unemployment benefits
The welfare state vision (1950s-1980s)
By mid-century, governments embraced a comprehensive "welfare state" approach, providing support from childhood through old age. Costs increased due to:
- Rising life expectancy
- Population ageing
- Higher unemployment rates
Targeted programs (1980s onwards)
Governments introduced means testing to control costs by limiting benefits to those on lower incomes. However, social security spending continues growing, primarily because:
- Australia's population is rapidly ageing
- Age-related benefits (pensions, health care) increase as more people reach retirement
- Demand for aged care services expands
Means Testing Explained
Means testing restricts benefit payments to individuals or households below certain income or wealth thresholds. This targets government spending to those most in need, reducing overall expenditure while maintaining support for lower-income groups.
Current trends and future pressures
The public sector has stabilised at around 40% of GDP since the late 1980s, with many taxes reduced or abolished and spending constrained. However, the government's size may increase due to:
Health care demands: An ageing population requires more medical services and aged care support
National security: Threats may require increased defence spending
Economic crises: Financial system instability or sudden economic contractions may necessitate government intervention to stabilise the economy
Infrastructure needs: Growing urban populations create demands for transport and utility infrastructure
Future Fiscal Challenges
These pressures suggest that maintaining the public sector at current levels relative to GDP will be challenging. Policymakers face difficult choices between raising taxes, cutting other spending areas, or allowing the public sector to expand.
Remember!
Key Points to Remember:
- The public sector includes all three levels of government plus government-owned businesses
- Two main measures: spending as % of GDP (around 40%) and employment as % of workforce (around 16%)
- Growth after WWII was driven by Keynesian economics, welfare state expansion, and rising service expectations
- Privatisation and contracting out reduced public sector employment from 25.5% (1985) to 16% (2000 onwards)
- Government spending composition has shifted from infrastructure toward social welfare and transfer payments
Key Terms:
- Public sector: Parts of the economy owned or controlled by government
- Transfer payments: Social welfare payments redistributed to households (pensions, benefits)
- Keynesian economics: Theory that government spending can stimulate economic activity and employment
- Privatisation: Sale of government-owned businesses to private sector
- Means testing: Restricting benefits to those below certain income/wealth thresholds
Essential Data:
- Public sector outlays: Currently 39-43% of GDP, up from 19.9% in 1949-50
- Public sector employment: Currently 16% of workforce, down from 25.5% peak in 1985
- Transfer payments: Approximately one-third of Commonwealth Government expenditure