Applications (HSC SSCE Mathematics Advanced): Revision Notes
Applications
Learning objectives
After studying this topic, you will be able to:
- Apply exponential functions to model real-world scenarios
- Interpret the parameters in exponential models, including the initial amount and growth factor
- Sketch graphs of exponential models while considering practical domain and range restrictions
- Use exponential functions to make predictions and solve problems in context
Applications of exponential graphs
Exponential functions are powerful tools for representing real-world scenarios where values increase or decrease by a fixed multiplier at regular intervals. Common applications include population growth, radioactive decay, and compound interest. When we graph these functions, we can identify important characteristics such as intercepts, asymptotes, and end behaviour, which help us understand and predict real-world situations.
Understanding exponential graphs allows you to model and predict real-world phenomena with remarkable accuracy. The key is recognizing when a situation involves a constant growth or decay factor rather than a constant rate of change.
Understanding exponential models
An exponential function has the general form , where:
- represents the initial amount (the starting value when )
- is the growth factor or base
- When , the function models growth
- When , the function models decay
Critical Distinction:
When the base , you have exponential growth - the function increases as increases.
When , you have exponential decay - the function decreases as increases.
This relationship between the base and the type of behaviour is fundamental to understanding exponential models.
Example 1: Modelling bacterial population growth
A bacterial population grows according to the function , where is the number of cells and is time in hours.
We need to sketch the graph and identify the asymptote, y-intercept, domain, and range.
Worked Example: Bacterial Population Growth
To sketch this graph, we first identify the key features using the form :
For , we have and .
Finding key features:
-
Asymptote: The horizontal asymptote is at (the number of cells can only approach zero as time goes backwards towards negative infinity, but time cannot actually be negative in this context)
-
y-intercept: When , we calculate:
-
Domain: Since time cannot be negative in this context,
-
Range: Since the population starts at and grows without bound, (or more specifically, for the practical domain)
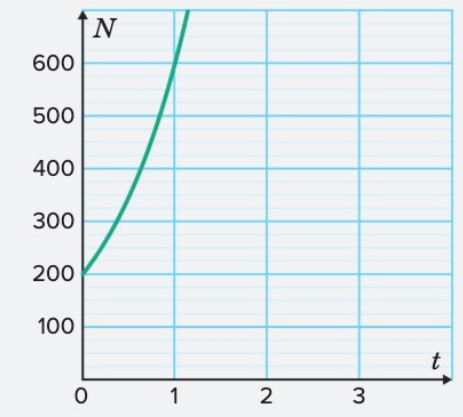
The graph shows exponential growth starting from cells at and increasing rapidly as time progresses.
Example 2: Modelling compound interest
A savings account earns compound interest modelled by , where is time in years.
Part a: Sketching the graph
Worked Example: Sketching a Compound Interest Graph
Strategy:
To sketch an exponential graph, we need to:
- Find the y-intercept by setting
- Identify the horizontal asymptote for a function of the form , which is
- Calculate an additional point by substituting a value for (such as )
- Plot these points and the asymptote, then draw the curve
Solution:
The y-intercept occurs when :
So the point is .
The horizontal asymptote is .
For an additional point, we substitute :
The point is approximately .
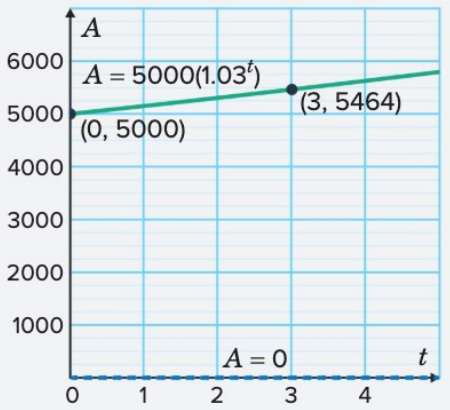
The graph shows a positive y-intercept and increases over time, which makes sense for a savings account earning interest. All key features are clearly labelled on the graph.
Part b: Describing end behaviour
Worked Example: Analyzing End Behaviour
Strategy:
To analyze end behaviour, we examine what happens to the function as becomes very large. Since the base is greater than , this represents exponential growth.
Solution:
As , the term increases without bound. Since we're multiplying this ever-increasing value by , the account balance also tends to infinity.
The end behaviour is: as , .
This makes sense in the real world, as a savings account with compound interest will continue to grow indefinitely over time (assuming no withdrawals are made).
Part c: Finding the balance after 3 years
Worked Example: Calculating Account Balance
Strategy:
We substitute into the formula and evaluate.
Solution:
Checking our answer:
The balance of $5464 is greater than the initial $5000, which makes sense because the account earns interest. This value also matches the point we calculated when sketching the graph.
Key concepts about exponential functions
Exponential graphs are excellent tools for modelling growth or decay in real-world situations. They display key features including:
- Asymptotes that show limiting values
- Intercepts that represent initial conditions
- End behaviour that describes long-term trends
Euler's Number - A Special Case
An important special case is Euler's number . The function is unique because it has a gradient of 1 at and is its own derivative. This property makes it particularly useful for modelling applications like population growth and continuous compound interest.
Remember!
Key Points to Remember:
- Exponential functions model situations with constant growth or decay factors, such as population changes or compound interest
- The general form has an initial value of and a growth factor of
- When sketching exponential graphs, always identify the asymptote, y-intercept, domain, and range
- For growth (): as ,
- The function is special because it equals its own derivative, making it ideal for natural growth models