Piecewise Functions (HSC SSCE Mathematics Advanced): Revision Notes
Piecewise Functions
What is a piecewise function?
A piecewise function is a function that uses different mathematical rules for separate intervals of its domain. Rather than having one single formula that works for all input values, a piecewise function switches between different expressions depending on which part of the domain the input falls into.
For example, consider the function:
This function uses three different rules:
- When , the function follows (a quadratic)
- When , the function follows (a linear function)
- When , the function follows (a cubic)
Each piece of a piecewise function has its own domain interval and mathematical rule. The key is identifying which rule applies to which interval of x-values.
Continuity and discontinuity
Continuous functions
A continuous function has a graph with no gaps or jumps. The key characteristic is that you can draw the entire graph without lifting your pen from the paper. When a piecewise graph has all its pieces connected smoothly at the boundary points, it creates a continuous piecewise function.
Memory aid: "Can't lift the pen" = Continuous function
A helpful way to remember continuity is to imagine drawing the graph on paper. If you can trace the entire function without lifting your pen, it's continuous!
Discontinuity
A discontinuity occurs at a point where the graph of a function is broken. At this point, the function is not continuous and the function value may be undefined or may jump from one value to another.
If the separate pieces of a piecewise function are disconnected at any boundary point, the function has discontinuities at those points.
Checking for continuity at boundary points
To determine whether a piecewise function is continuous at a boundary point, you need to evaluate each piece of the function at that point. If both pieces give the same output value, the function is continuous there. If they give different values, there is a discontinuity.
Worked Example: Checking for Discontinuity
Consider the piecewise function:
Step 1: Identify the boundary point
The boundary point is at where the function definition changes.
Step 2: Evaluate the first piece at
For the piece (where ):
Step 3: Evaluate the second piece at
For the piece (where ):
Step 4: Compare the values
Since the two pieces produce different y-values at (one gives and the other gives ), the function is not continuous at this point. There is a discontinuity at .
The graph shows that the function uses for and for . The two pieces do not meet at the same point when , confirming the discontinuity.
Sketching piecewise functions
When sketching a piecewise function, graph each piece over its corresponding domain interval. Pay careful attention to:
- Whether endpoints are included (closed circle) or excluded (open circle)
- The behaviour at boundary points
- Key features like intercepts and turning points
Critical Sketching Rules:
- Use a closed circle (●) for endpoints that are included in the domain (≤ or ≥)
- Use an open circle (○) for endpoints that are excluded from the domain (< or >)
- Always check each boundary point to determine if the function is continuous
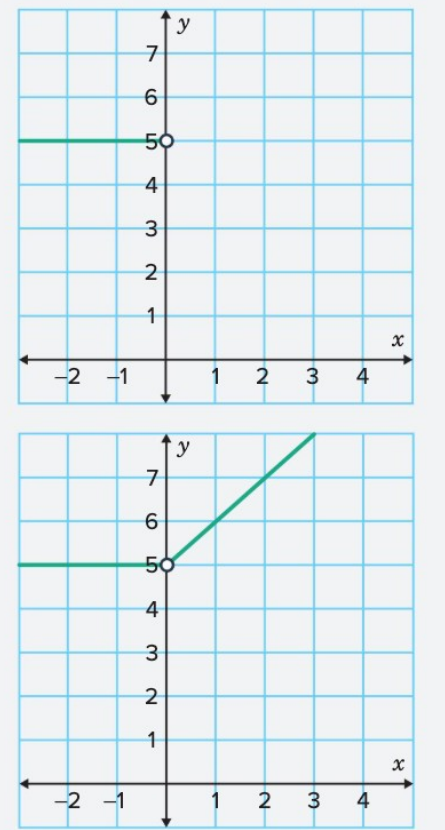
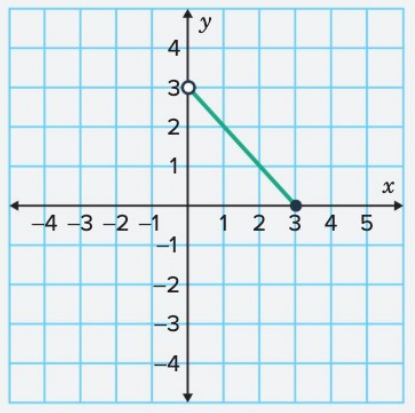
Worked Example: Sketching with Linear Pieces
Sketch the piecewise function:
Strategy: Graph each linear function over its specified interval.
Step 1: Graph the constant function for
For , graph the constant function .
Since this is a constant function, it creates a horizontal line at . Because the function is not defined at , place an open circle at the point to show this value is not included.
Step 2: Graph the linear function for
For , graph the linear function .
This line has a gradient of and a y-intercept of . Since is not included in this piece either, place an open circle at on this piece as well.
Conclusion: The function is discontinuous at because the graphs are not connected at this boundary point.
Finding the function definition from a graph
When given a piecewise graph, you need to work backwards to determine the mathematical rules. The process involves:
- Identify the distinct parts of the graph
- Determine the domain for each part
- Find the equation for each part
- Write the complete piecewise function
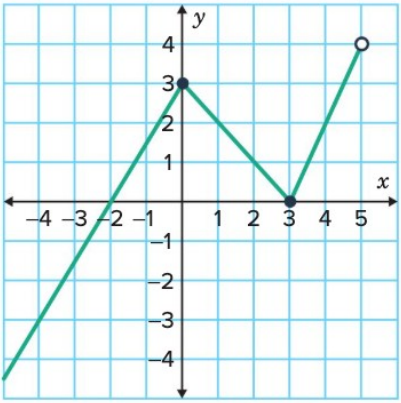
Worked Example: Determining the Function Definition
Looking at this graph, there are three distinct linear segments.
First segment (for ):
This segment exists from to . It's a linear function with:
- Gradient:
- y-intercept:
Therefore: in the domain
Second segment (for ):
This segment exists between and (not including due to the open circle, but including ). It's a linear function with:
- Gradient:
- y-intercept:
Therefore: in the domain
Third segment (for ):
This segment exists between and (excluding both endpoints due to open circles). It's a linear function with:
- Gradient:
- y-intercept:
Therefore: in the domain
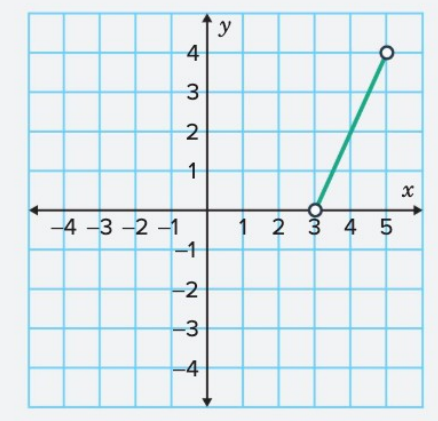
Complete piecewise function:
Non-linear piecewise functions
Piecewise functions can include non-linear functions such as quadratics and cubics, defined over specific domains. When graphing these, you need to identify key features like turning points, intercepts, and endpoints. Always check continuity at domain boundaries to identify discontinuities.
Key Features to Identify for Non-Linear Pieces:
- Quadratics: Turning point (vertex), intercepts, direction of opening
- Cubics: Inflection point, intercepts, end behavior
- All pieces: Boundary values at endpoints of the domain interval
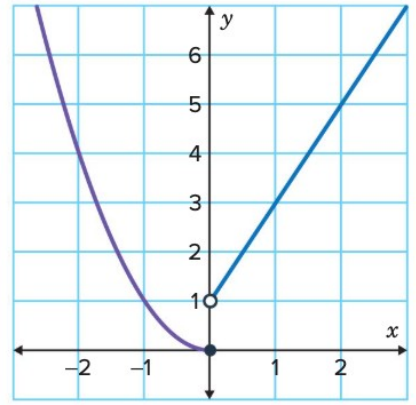
Example: Piecewise Function with Quadratic
Consider the piecewise function:
To check continuity at , evaluate both pieces at this boundary point.
For :
For :
Since the y-values from the two pieces are different at the boundary point (), the two parts of the graph do not meet. Therefore, the function has a discontinuity at .
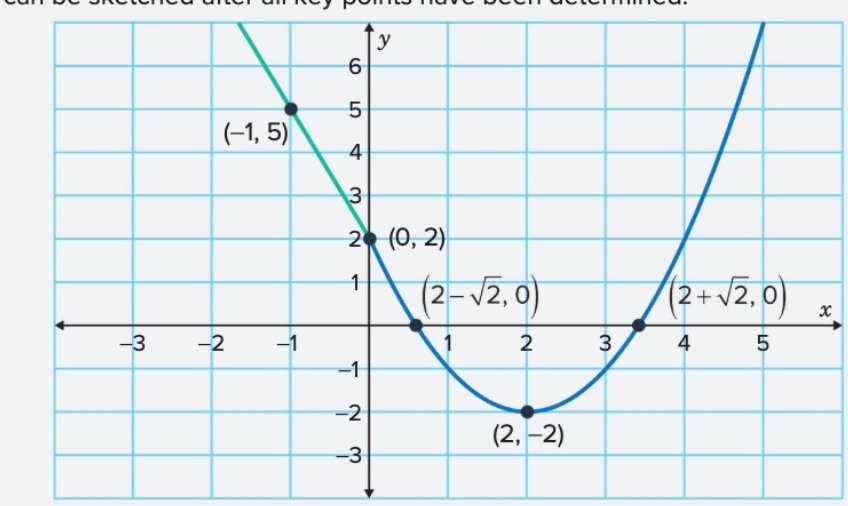
Worked Example: Sketching with Quadratic and Linear Pieces
Sketch the graph of:
Strategy: Graph each function over its corresponding interval, identifying key points.
For the linear piece (where ):
To sketch a line, find two points. First, evaluate at the boundary :
The boundary point is at .
Choose another value, say :
So is on the line .
For the quadratic piece (where ):
First, find the endpoint at :
This parabola has an endpoint at .
The equation is in turning point form, so the turning point (vertex) is at .
To find the x-intercepts, set :
The two x-intercepts are and .
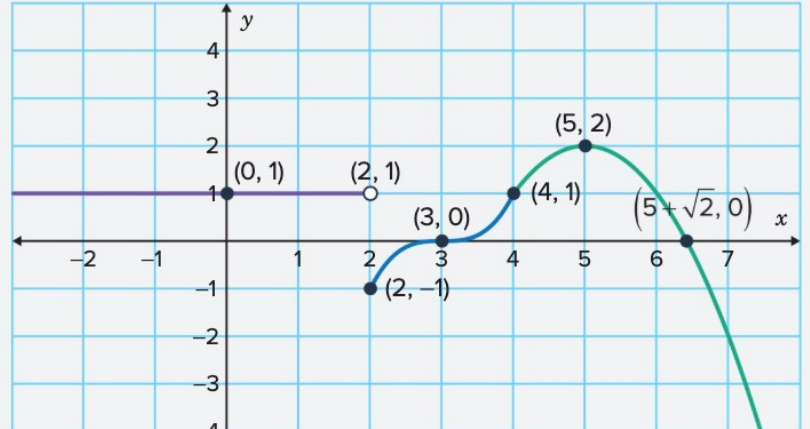
Worked Example: Sketching with Cubic Pieces
Sketch the graph of:
For the constant piece (where ):
This is a horizontal line with zero gradient at .
For the cubic piece (where ):
Find the endpoints by using and :
At :
The cubic has an endpoint at .
At :
The cubic has an endpoint at .
For the quadratic piece (where ):
Evaluate at the boundary :
The boundary point is at .
The parabola is in vertex form, so the turning point is at . Since this occurs at and the domain is , this turning point will appear on the graph.
To find the x-intercept, set :
Since the domain is , check which intercept is valid. Both and could potentially work, but , so it's not in the domain. Only is on the graph.
The complete sketch shows all three pieces with their respective domains and key points.
Even and odd piecewise functions
To determine if a piecewise function is even or odd, you need to compare with or :
- For an even function:
- For an odd function:
Critical Consideration for Piecewise Functions:
In a piecewise function, and may be defined by different expressions depending on which interval and fall into.
The process involves:
- Identify which piece(s) define
- Identify which (possibly different) piece(s) define
- Evaluate and compare with
This requires careful attention to which domain intervals contain the positive and negative values you're comparing.
Memory aids for Even and Odd Functions:
- "Even is Equal": (the graph is symmetric about the y-axis)
- "Odd is Opposite": (the graph has rotational symmetry about the origin)
Remember!
Key Points to Remember:
-
Piecewise functions use different rules for different intervals of the domain
-
A function is continuous if its graph has no gaps or breaks; you can draw it without lifting your pen
-
A discontinuity occurs where the graph breaks or jumps
-
To check continuity at a boundary point, evaluate each piece at that point; if the values differ, there's a discontinuity
-
When graphing piecewise functions, identify key features for each piece: intercepts, turning points, gradients, and endpoints
-
Use open circles for excluded endpoints and closed circles for included endpoints
-
For non-linear pieces (quadratics, cubics), find turning points, intercepts, and boundary values before sketching
-
To determine if a piecewise function is even or odd, compare with or , being careful about which piece defines each value