Graphs of Reciprocal Functions (HSC SSCE Mathematics Advanced): Revision Notes
Graphs of Reciprocal Functions
What is a reciprocal function?
A reciprocal function has the form:
where is a constant and .
This type of function produces a graph called a rectangular hyperbola. The graph consists of two smooth curves that never touch the axes.
The simplest form is (where ). This creates one curve in the first quadrant (where and ) and another curve in the third quadrant (where and ).
Components of the reciprocal function
In the function :
- is the constant that scales the hyperbola. This value must not equal zero ().
- is the independent variable. The function is undefined when .
The restriction that is crucial - if were zero, we'd have for all , which would just be a horizontal line, not a hyperbola at all!
Understanding asymptotes
An asymptote is a straight line (or curve) that a graph approaches as tends towards positive infinity (), negative infinity (), or some particular value.
For example:
- The curve has an asymptote at as tends to
- The curve has asymptotes at and
Think of an asymptote as a boundary line that the curve gets infinitely close to but never actually touches. It's like a guide that shows where the function is heading.
Key features of reciprocal function graphs
Vertical asymptote
The function has important characteristics based on how fractions work:
The denominator cannot be zero because division by zero is undefined. In this case, the denominator is , so the function is undefined at .
This creates a vertical asymptote at . As approaches from the positive side ():
- If , then
- If , then
As approaches from the negative side ():
- If , then
- If , then
Why does the vertical asymptote exist?
Remember: You cannot divide by zero! When , we would have , which is undefined in mathematics. This is why the graph can never cross or touch the -axis.
Horizontal asymptote
A fraction equals zero only if the numerator is zero. Here, the numerator is , and we know that . Therefore, can never equal zero.
This creates a horizontal asymptote at .
Why does the horizontal asymptote exist?
Since (by definition), the numerator is never zero. A fraction can only equal zero if its numerator is zero. Therefore, can never equal zero, which is why the graph never crosses or touches the -axis.
Rectangular shape
The asymptotes intersect at right angles (perpendicular to each other), which gives the graph its "rectangular" hyperbola name.
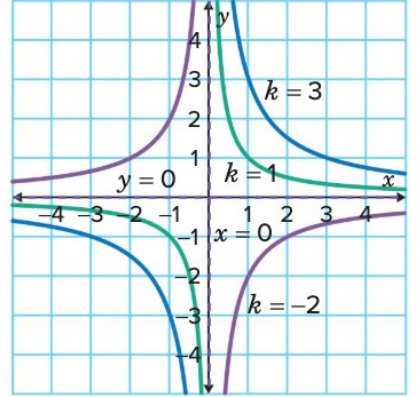
The graph above illustrates for , , and , showing the hyperbolic shape and asymptotes.
Effect of the sign of k
The sign of determines which quadrants contain the curves:
- If : curves lie in quadrants 1 and 3
- If : curves lie in quadrants 2 and 4
Memory aid: "Positive lives in 1 and 3" - positive values place curves in quadrants 1 and 3. "Negative , 2 and 4 it be" - negative values place curves in quadrants 2 and 4.
Effect of the magnitude of k
The magnitude (absolute value) of scales the hyperbola. Larger values stretch the curves away from the origin, while smaller values bring the curves closer to the origin.
In other words:
- A larger makes the curves "wider" and further from the axes
- A smaller makes the curves "tighter" and closer to the axes
End behaviour
The behaviour of as approaches infinity or negative infinity describes how approaches the horizontal asymptote.
As x approaches positive infinity
As , the denominator becomes very large, making approach :
- If , then from the positive side
- If , then from the negative side
As x approaches negative infinity
As , the denominator becomes a large negative number:
- If , then from the negative side
- If , then from the positive side
Notice how the direction from which approaches zero depends on both the sign of and whether is positive or negative. This creates the characteristic hyperbola shape with curves in opposite quadrants.
Worked example 1: Creating a table and plotting the graph
Worked Example: Completing a Table of Values and Graphing
Question: Consider the function .
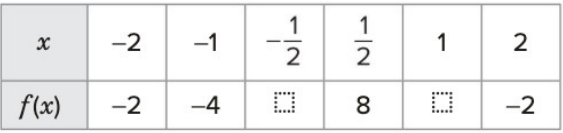
(a) Complete the table of values for :
Strategy:
Substitute each value into to calculate .
Solution:
If :
If :
The completed table is:
(b) Plot the points from the table and identify the asymptotes.
Strategy:
Plot the points on a Cartesian plane and determine the vertical and horizontal asymptotes by finding where the function is undefined.
Solution:
Determining the vertical asymptote:
Set the denominator equal to zero:
A fraction with a zero denominator is undefined. So the vertical asymptote is .
Determining the horizontal asymptote:
A fraction is only equal to zero when its numerator is zero. Since , we have . Therefore, a horizontal asymptote exists at .
Plotting the points and asymptotes:
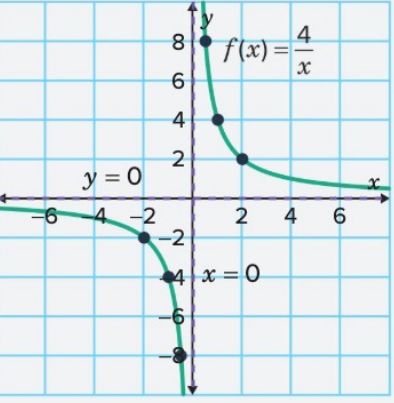
The points lie in quadrants 1 and 3, which is consistent with .
Worked example 2: Describing end behaviour
Worked Example: Analyzing End Behaviour
Question: Describe the behaviour of as and as .
Strategy:
Evaluate for large positive and negative values, considering the sign of .
Solution:
To consider , test with :
As , from the negative side, since .
To consider , test with :
As , from the positive side, since .
Key observation: The negative causes to approach from opposite sides compared to positive .
Remember!
Key Points to Remember:
- The function forms a rectangular hyperbola with two curves
- There is a vertical asymptote at and a horizontal asymptote at
- When , curves are in quadrants 1 and 3; when , curves are in quadrants 2 and 4
- As : if then from positive side; if then from negative side
- As : if then from negative side; if then from positive side
- The sign of determines quadrant placement, while the magnitude of determines how stretched the hyperbola is