Speed as a Rate of Change (HSC SSCE Mathematics Advanced): Revision Notes
Speed as a Rate of Change
What you'll learn
In this topic, you will learn how to work with speed as a rate of change. By the end of this note, you should be able to:
- Define speed as the rate of change of distance with respect to time
- Calculate the average speed of an object from a given distance-time function or graph
- Interpret the gradient of a secant line on a distance-time graph as average speed
Understanding speed as a rate of change is fundamental to kinematics and provides a practical application of the rates of change concept you've been studying.
Understanding speed and velocity
Before we dive into calculations, it's important to understand the difference between speed and velocity. While these terms are often used interchangeably in everyday language, they have distinct mathematical meanings.
Speed is the absolute value of an object's velocity. It tells us how fast an object is moving, regardless of which direction it's travelling. Because speed only measures magnitude (not direction), it is always greater than or equal to zero. Speed is a scalar quantity, meaning it only has size, not direction.
Velocity, on the other hand, is the rate of change of an object's position with respect to time. Unlike speed, velocity is a vector quantity, which means it has both magnitude and direction. The SI units for velocity are metres per second (). When we calculate average speed, we're essentially finding the magnitude of the average velocity.
Key Distinction:
- Speed (scalar) = magnitude only, always ≥ 0
- Velocity (vector) = magnitude + direction, can be positive or negative
For objects moving along a straight line (such as along the -axis), we can calculate average speed using a straightforward formula based on the distance travelled and the time taken.
The average speed formula
Speed represents the rate of change of distance with respect to time. For a distance function , where distance is measured over a time interval , the average speed is defined mathematically as:
Let's break down what each part of this formula means:
- represents the change in distance, calculated as
- represents the change in time, calculated as
This formula is analogous to the general concept of average rate of change, where distance is the output variable and time is the input variable. The units for speed are typically metres per second () or kilometres per hour (), depending on the context of the problem.
The key insight is that average speed tells us how much distance is covered per unit of time over a given interval. If an object travels km in hours, its average speed is km/h, even if it sped up and slowed down during that time.
Calculating average speed from distance functions
Let's work through a complete example to see how we apply the average speed formula to a distance function.
Worked Example: Calculating Average Speed from a Distance Function
A car travels according to the distance function , where is in kilometres and is in hours. Calculate the average speed from to .
Solution:
First, we identify our strategy. We'll use the formula with and .
Next, we evaluate at :
Now we evaluate at :
We can now solve for the average speed:
Therefore, the average speed is 60 km/h.
Reflection: Notice that the constant speed of km/h reflects the linear function's gradient. Because is a linear function with gradient , the car travels at a constant rate of km for every hour that passes. This is consistent with a steady rate of travel throughout the journey.
Distance-time graphs and gradient
A distance-time graph is a line graph that shows the relationship between distance and time. By convention, time is plotted on the horizontal axis and distance on the vertical axis. These graphs provide a visual way to understand motion and calculate average speed.
The gradient of a line segment on a distance-time graph represents the average speed over that time interval. When we calculate the gradient of the secant line between two points on the graph, we're finding the average speed between those two times.
Understanding Graph Gradients:
- For a straight-line segment, the speed is constant, so the average speed equals the instantaneous speed at any point on that segment
- For a curved section, the speed varies, and the gradient of the secant line gives us the average speed over that interval
Let's see how this works with a practical example.
Worked Example: Finding Average Speed from a Distance-Time Graph
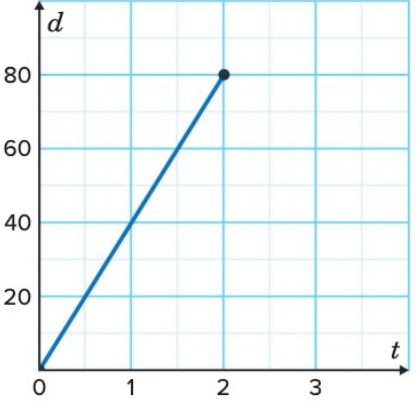
The distance-time graph below shows a cyclist's journey. The gradient of the secant line between points at and gives the average speed in km/h. Calculate the average speed from to hours.
Solution:
Our strategy is to find the gradient of the secant line between the points and using the formula .
First, we calculate the change in distance:
Next, we calculate the change in time:
Now we can calculate the average speed:
Therefore, the average speed is 40 km/h.
Reflection: The straight line on the graph indicates that the cyclist maintains a constant speed throughout the journey. This is why the average speed equals the gradient of the line segment. If the graph had been curved, the speed would have been changing, but the gradient of the secant line would still give us the average speed over the interval.
Exam tips
Essential Tips for Speed Problems:
When working with speed problems, keep these points in mind:
- Always check the units given in the question. Make sure your answer uses the appropriate units (km/h, m/s, etc.)
- For distance-time graphs, remember that a steeper gradient means higher speed
- A horizontal line on a distance-time graph indicates the object is stationary (zero speed)
- A straight line indicates constant speed; a curve indicates changing speed
- Show all your working clearly, particularly when substituting values into formulas
Remember!
Key Points to Remember:
-
Speed is the rate of change of distance with respect to time, calculated using the formula
-
Speed is always non-negative (≥ 0), while velocity can be positive or negative depending on direction
-
On distance-time graphs, the gradient of a secant line represents average speed over that time interval
-
Common units for speed include metres per second (m/s) and kilometres per hour (km/h)
-
A straight line on a distance-time graph indicates constant speed, while a curved line indicates varying speed