Venn Diagrams (HSC SSCE Mathematics Advanced): Revision Notes
Venn Diagrams
What is a Venn diagram?
A Venn diagram is a visual tool used to represent sets and their relationships. It uses overlapping circles to show how different groups relate to each other. Each circle represents a set, and these circles are drawn within a rectangle that represents the universal set.
Venn diagram: A graphical representation using overlapping circles to show elements of sets in relation to their properties or attributes. They are drawn for a specified universal set.
Venn diagrams help us understand set operations in practical situations. They make it easier to identify common or unique elements between groups, and they illustrate relationships between events in a sample space.
Key components of a Venn diagram
When working with two sets and , a Venn diagram has several important parts:
- The universal set () is shown as a rectangle containing all possible elements
- Each set is represented by a circle within the rectangle
- The region inside a circle represents all elements belonging to that set
- Different regions represent different set operations
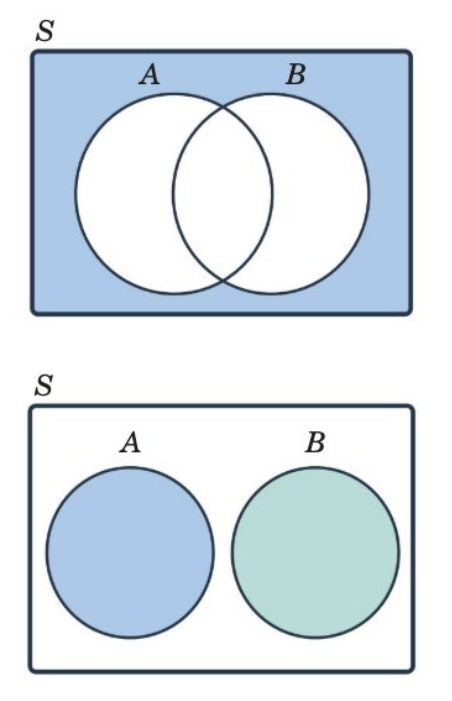
The diagram above shows two scenarios: overlapping circles (where sets share common elements) and disjoint circles (where sets have no elements in common).
Representing set operations
Intersection ()
The intersection of two sets is where the circles overlap. This region contains elements that belong to both sets.
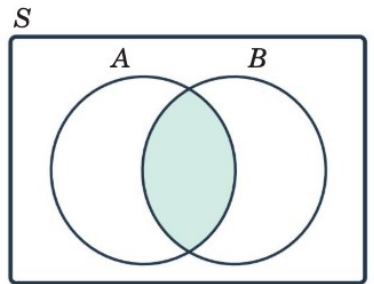
The shaded region shows , which includes all elements that are in set and in set at the same time.
Think of intersection as "AND" — an element must be in set AND in set to be part of the intersection.
Union ()
The union of two sets is the combined area of both circles. This region contains elements that belong to either set (or both).
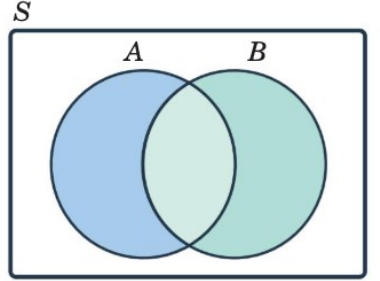
The shaded region shows , which includes all elements that are in set or in set (or in both).
Think of union as "OR" — an element can be in set OR in set (or in both) to be part of the union.
Complement ()
The complement of a set is the area outside that set but still within the universal set. This region contains elements that do not belong to the set.
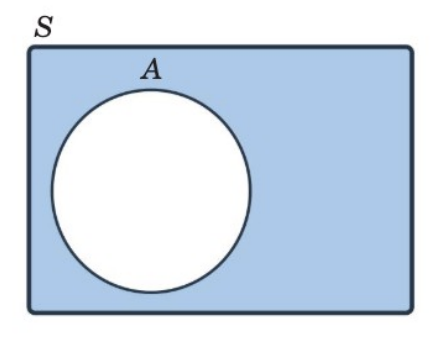
The shaded region shows , which includes all elements in the universal set that are not in set .
The cardinality rule for unions
The cardinality of a set is simply the number of elements it contains. When we want to find how many elements are in the union of two sets, we need to be careful not to count elements twice.
The cardinality rule for the union of two sets:
where:
- is the number of elements in the union (elements in or )
- and are the number of elements in sets and respectively
- is the number of elements in the intersection (elements in both and )
Why do we subtract the intersection? When we add and , we count the elements in twice (once in and once in ). To avoid this double-counting, we subtract once.
This rule is extremely useful for calculating the total number of elements in practical problems involving overlapping groups.
Memory aid: "Add All, Subtract Shared" — Add all elements from both sets, then subtract the shared ones to avoid counting them twice.
Worked example 1: Art and music students
Worked Example: Art and Music Students
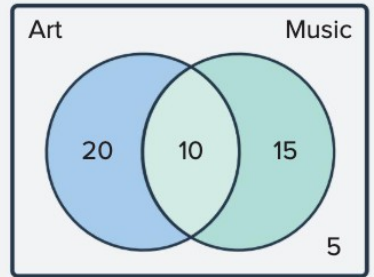
Problem: In a school of 50 students, 30 take art, 25 take music, and 10 take both.
Part a: Draw a Venn diagram
Strategy: Use two overlapping circles for art and music within the universal set. Place 10 in the overlap, then distribute the remaining students.
Solution:
Let = Art and = Music.
The overlap is .
Students who take art only =
Students who take music only =
Students who take neither =
Part b: Calculate students taking art or music
Strategy: Sum the values in all regions of the Venn diagram (art only, music only, and overlap).
Solution:
From the Venn diagram:
- Art only = 20
- Music only = 15
- Overlap = 10
Total =
Total = 45 students
Therefore, 45 students take art or music.
Part c: Students taking neither
Strategy: Use the number outside both circles in the Venn diagram.
Solution:
From the Venn diagram, the value outside both circles is 5.
So, 5 students take neither art nor music.
Verification: We can check our answer by adding all values: , which matches the total number of students.
Worked example 2: Biology and chemistry students
Worked Example: Biology and Chemistry Students
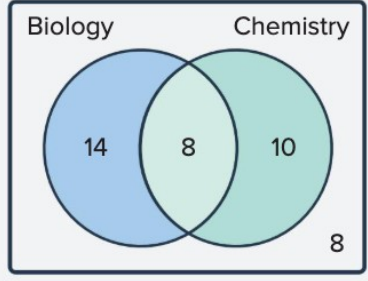
Problem: In a group of 40 students, 22 study biology, 18 study chemistry, and 8 study both.
Part a: Draw a Venn diagram
Strategy: Use two overlapping circles for biology and chemistry within the universal set. Place 8 in the overlap and distribute remaining students.
Solution:
Let = Biology and = Chemistry.
The overlap is .
Students who take biology only =
Students who take chemistry only =
Students outside both circles =
Part b: Students studying biology or chemistry
Strategy: Use the cardinality rule formula:
Solution:
The students who study biology:
The students who study chemistry:
The students who study both:
So, 32 students study biology or chemistry.
Part c: Students studying only chemistry
Strategy: Subtract the overlap from the total number of chemistry students.
Solution:
Only chemistry =
So, 10 students study only chemistry.
Verification: Adding all values gives , which matches the total.
Remember!
Key Points to Remember:
-
Venn diagrams visualise sets as circles within a universal set (shown as a rectangle). Overlapping regions show elements common to multiple sets.
-
The intersection () is where circles overlap, representing elements in both sets. The union () is the combined area, representing elements in either set.
-
The complement () is the area outside a set but within the universal set, representing elements not in that set.
-
The cardinality rule helps calculate total elements in a union by avoiding double-counting the intersection.
-
When solving problems, start by placing the intersection value, then work outwards to find elements in each set only, and finally calculate elements outside all sets.