Graph Parabolas (HSC SSCE Mathematics Advanced): Revision Notes
Graph Parabolas
Understanding quadratic functions in standard form
A quadratic function is written in standard form as , where . This form gives us important information about the shape and position of the parabola. Let's look at what each coefficient tells us.
The coefficient determines the concavity of the parabola. This means it tells us whether the parabola opens upward or downward. When , the parabola is concave up (shaped like a U), and when , the parabola is concave down (shaped like an upside-down U). The value of also affects how steep or wide the parabola appears.
The coefficient works together with to affect the vertex position. The vertex is the turning point of the parabola - either the minimum point (when opening upward) or the maximum point (when opening downward).
The coefficient is the y-intercept of the parabola. This is the point where the graph crosses the y-axis, which occurs at the coordinate .
Steps to graph a parabola
To sketch an accurate graph of a parabola, we need to identify several key features in a systematic way. Here's the complete process.
Finding the y-intercept
The y-intercept is the easiest feature to find. Simply set in the equation, which gives us . The y-intercept is at the point .
Finding the x-intercepts
The x-intercepts (also called roots or zeros) are the points where the parabola crosses the x-axis. These occur when . To find them, we need to solve the equation .
The quadratic formula provides a reliable method for finding x-intercepts:
Before using the quadratic formula, we can check the discriminant, . The discriminant tells us:
- If is a perfect square, we can factorise the quadratic easily
- If is positive but not a perfect square, we'll have two irrational x-intercepts
- If , we have exactly one x-intercept (the vertex touches the x-axis)
- If , there are no x-intercepts (the parabola doesn't cross the x-axis)
While factorisation can be quicker for simple quadratics, it's often most efficient to use the quadratic formula directly, especially in exam situations. This ensures you don't miss solutions or make factorisation errors.
Finding the axis of symmetry
The axis of symmetry is a vertical line that divides the parabola into two mirror images. Its equation is:
This line always passes through the vertex of the parabola.
Finding the vertex
Once we know the axis of symmetry, we can find the vertex. The x-coordinate of the vertex is . To find the y-coordinate, substitute this x-value back into the original function .
The vertex is located at .
Determining domain and range
For any parabola, the domain is all real numbers, written as or . This is because we can substitute any x-value into a quadratic function.
The range depends on the concavity and the vertex's y-coordinate. Let be the y-coordinate of the vertex:
- If (concave up), the range is
- If (concave down), the range is
Worked example: Monic quadratic
Worked Example: Graphing a Monic Quadratic
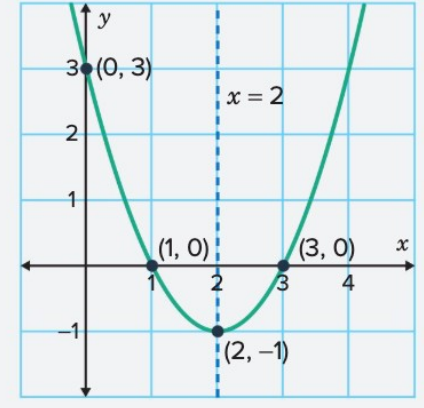
Let's work through a complete example with .
Finding the x-intercepts
First, we set and use the discriminant to determine whether we can factorise or should use the quadratic formula.
Since the discriminant equals 4, which is a perfect square (), we can factorise the equation.
The x-intercepts are and .
Finding the y-intercept
To find the y-intercept, we substitute :
The y-intercept is at .
Finding the axis of symmetry and vertex
Using the formula for the axis of symmetry:
The axis of symmetry is the line .
To find the vertex, we substitute into the function:
The vertex is at .
Determining domain and range
The domain is (all real numbers).
Since , the parabola is concave up with a minimum at . Therefore, the range is [].
Sketching the graph
We now plot all the key features: x-intercepts at and , y-intercept at , vertex at , and the axis of symmetry at . The parabola opens upward.
Graphing non-monic quadratics
When the coefficient , we call the quadratic non-monic. The process for graphing non-monic quadratics is exactly the same as for monic quadratics: find the x-intercepts, y-intercept, axis of symmetry, vertex, domain, and range.
The key difference is that the coefficient affects the steepness of the parabola. A larger value of makes the parabola steeper (narrower), while a smaller value makes it wider.
Worked example: Non-monic quadratic
Worked Example: Graphing a Non-Monic Quadratic
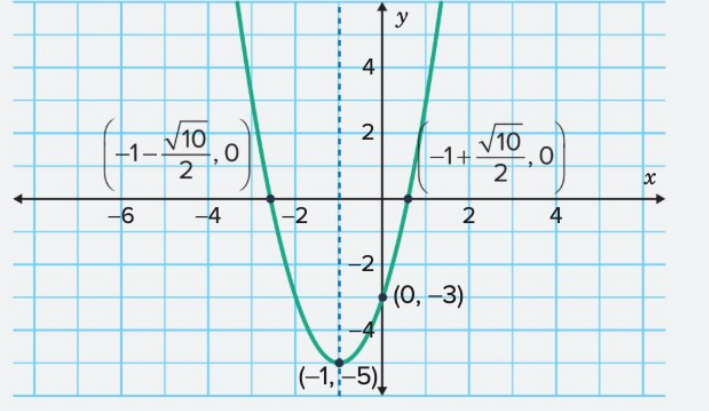
Let's work through .
Finding the x-intercepts
We set and calculate the discriminant to decide our approach.
Since the discriminant equals 40, which is not a perfect square, we need to use the quadratic formula.
The x-intercepts are and .
Finding the y-intercept
Substituting :
The y-intercept is at .
Finding the axis of symmetry and vertex
Using the axis of symmetry formula:
The axis of symmetry is .
For the vertex, substitute :
The vertex is at .
Determining domain and range
The domain is .
Since , the parabola is concave up with a minimum at . The range is [].
Sketching the graph
We plot the x-intercepts and , the y-intercept , the vertex , and draw the axis of symmetry at . The parabola opens upward and is steeper than a monic parabola because .
Key Points to Remember:
- A quadratic function in standard form is , where means concave up and means concave down
- To find x-intercepts, use the quadratic formula or factorise if the discriminant is a perfect square
- The axis of symmetry is always , and the vertex lies on this line
- The domain of any parabola is always , but the range depends on the concavity and vertex
- Non-monic quadratics follow the same graphing process as monic quadratics, but the value of affects the steepness of the parabola