Dilations (HSC SSCE Mathematics Advanced): Revision Notes
Dilations
What are dilations?
A dilation is a transformation that changes the size of a function's graph by stretching or compressing it. This transformation can occur in the horizontal direction (along the x-axis), in the vertical direction (along the y-axis), or in both directions simultaneously. Unlike translations that shift a graph's position, dilations change the graph's scale while keeping key features like the general shape intact.
Understanding dilations helps you predict how changes to a function's equation will affect its graph, which is essential for modelling real-world situations where scaling is involved.
Horizontal dilations
A horizontal dilation stretches or compresses a graph in the x-direction, away from the y-axis. This means that the x-coordinates of all points on the graph are scaled by a certain factor, whilst the y-coordinates remain unchanged.
How horizontal dilations work
For any function , we can create a horizontal dilation by replacing with in the function:
This transformation has the following effects:
-
When k > 1: The graph stretches horizontally. Each point on the original graph moves to the point on the dilated graph. The graph becomes wider.
-
When 0 < k < 1: The graph compresses horizontally. The graph becomes narrower.
The key idea is that horizontal dilations scale x-coordinates whilst keeping y-coordinates fixed. The graph stretches or compresses from the y-axis as the reference line.
Some functions can appear the same after different types of dilations. For example, with , a horizontal dilation by factor gives , which is the same as a vertical dilation by factor .
Vertical dilations
A vertical dilation stretches or compresses a graph in the y-direction, away from the x-axis. This means that the y-coordinates of all points on the graph are scaled by a certain factor, whilst the x-coordinates remain unchanged.
How vertical dilations work
For any function , we can create a vertical dilation by multiplying the entire function by a factor :
This transformation has the following effects:
-
When l > 1: The graph stretches vertically. Each point on the original graph moves to the point on the dilated graph. The graph becomes taller or steeper.
-
When 0 < l < 1: The graph compresses vertically. The graph becomes flatter or less steep.
The key idea is that vertical dilations scale y-coordinates whilst keeping x-coordinates fixed. The graph stretches or compresses from the x-axis as the reference line.
Worked example: Horizontal and vertical dilations
Let's examine how dilations affect the parabola .
Part a: Horizontal dilation by a factor of 3
Worked Example: Horizontal Dilation
Question: Find the equation and sketch the graph after a horizontal dilation by a factor of 3.
Strategy: To perform a horizontal dilation by factor , we substitute with in the original function.
Write the function
Substitute
Simplify
The equation of the dilated function is .
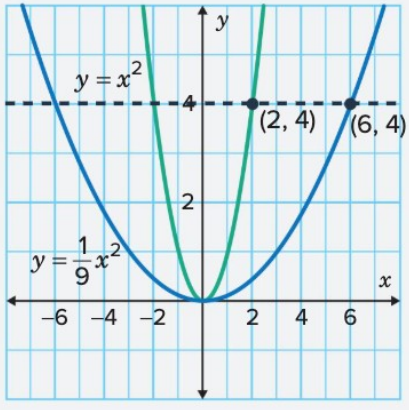
Effect on the graph: The parabola becomes wider. Each point on the original parabola moves horizontally away from the y-axis. For example, the point on stretches outwards to the point on .
Part b: Vertical dilation by a factor of 0.5
Worked Example: Vertical Dilation
Question: Find the equation and sketch the graph after a vertical dilation by a factor of 0.5.
Strategy: To perform a vertical dilation by factor , we substitute with and rearrange, which is equivalent to multiplying the function by 0.5.
Working:
(write the function)
(substitute )
(multiply both sides by )
The equation of the dilated function is .
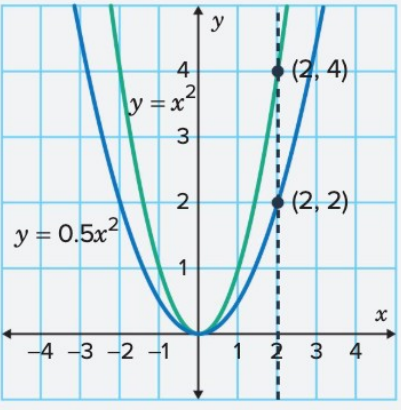
Effect on the graph: The parabola becomes flatter. Each y-value is halved, making the graph appear compressed vertically. For example, the point on compresses to the point on .
Part c: Describing the effects
Horizontal dilation (): This stretches each point on the parabola horizontally by a factor of 3, making the parabola 3 times as wide. The point moves outward to .
Vertical dilation (): This compresses each point on the parabola vertically by a factor of 0.5. Each y-value is halved, making the graph appear flatter. The point on the original parabola moves to after the dilation.
Key ideas
A horizontal dilation by factor is given by . It stretches from the y-axis. When k > 1, the graph stretches (becomes wider). When 0 < k < 1, the graph compresses (becomes narrower).
A vertical dilation by factor is given by . It stretches from the x-axis. When l > 1, the graph stretches (becomes taller). When 0 < l < 1, the graph compresses (becomes flatter).
Combined dilations
A combined dilation applies both horizontal and vertical dilations simultaneously, scaling the entire graph. For a function , we replace with and multiply by with . This gives:
This formula shows a geometric enlargement or reduction by a scale factor of :
-
When k > 1: The graph enlarges. Every point maps to , making the graph larger overall.
-
When 0 < k < 1: The graph reduces. The graph becomes smaller overall.
Example of geometric enlargement
Consider the function over the domain .
When we apply a geometric enlargement by factor 2, each point on the graph maps to . This scales both the x and y values uniformly.
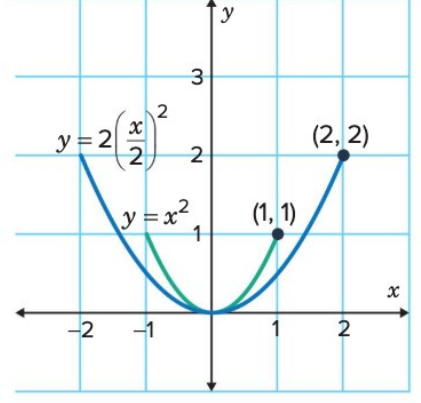
The point becomes , as shown on the graph. The original domain becomes , and the range, originally , becomes . This makes the graph larger in both width and height.
Worked example: Combined dilation
Let's examine how a combined dilation affects the cubic function .
Worked Example: Combined Dilation
Question: Find the equation after an enlargement by a factor of 2.
Strategy: For a combined dilation with factor , we substitute with and with .
Working:
(write the function)
(substitute and )
(multiply both sides by )
(evaluate the power)
(simplify) The equation is .
Sketching the graphs: The key point for is . Since the enlargement factor is 2, the transformed x-value corresponding to is .
To find the corresponding y-value on the transformed graph:
(write the function)
(substitute )
(evaluate the power)
(evaluate)
So the key point for is .
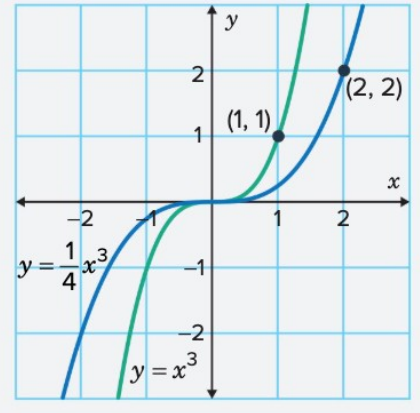
The graph of is an enlargement of by a factor of , mapping the point to the point .
Key ideas
A combined dilation by factor enlarges the graph if k > 1 or reduces it if 0 < k < 1. The dilation scales both axes uniformly from the origin. When sketching, remember that both x and y coordinates are scaled by the same factor, confirming the visual scaling effect.
Remember!
Key Points to Remember:
-
A dilation is a transformation that stretches or compresses a graph either horizontally, vertically, or both.
-
For horizontal dilations using : when k > 1 the graph stretches (wider), and when 0 < k < 1 the graph compresses (narrower). The stretch occurs from the y-axis.
-
For vertical dilations using : when l > 1 the graph stretches (taller), and when 0 < l < 1 the graph compresses (flatter). The stretch occurs from the x-axis.
-
A combined dilation using enlarges the entire graph when k > 1 or reduces it when 0 < k < 1, scaling uniformly from the origin.
-
The factor value determines the effect: factors greater than 1 cause stretching/enlargement, whilst factors between 0 and 1 cause compression/reduction.