Trigonometry (HSC SSCE Mathematics Advanced): Revision Notes
Graphs of Trigonometric Functions
This revision note covers the graphs of the three main trigonometric functions: sine, cosine, and tangent. Understanding these graphs and their key features is essential for working with trigonometric functions in mathematics.
Learning Objectives
After studying this topic, you should be able to:
- Graph and , identifying their key features including domain, range, period, and amplitude
- Graph and identify its key features, including domain, range, period, and asymptotes
- Show intercepts with the -axis and -axis for all three functions
- Determine whether each function is even or odd based on its graphical symmetry
Sine and cosine functions
Connection to the unit circle
The sine and cosine functions arise naturally from the unit circle. When we look at a point on the unit circle, we can describe its position using trigonometry.
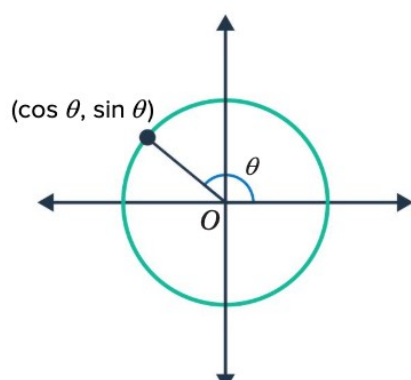
For a point on the unit circle at an angle measured anticlockwise from the positive -axis, the coordinates of that point are . This means the -coordinate gives us the cosine value, and the -coordinate gives us the sine value.
Values for common angles
It's helpful to know the sine and cosine values for commonly used angles. The table below shows sine values at key angles measured in radians:
As the angle increases from to , notice how the sine values move smoothly between and . This pattern reflects the circular motion around the unit circle, with sine values corresponding to the vertical position of the point on the circle.
Similarly, cosine values follow a pattern around the unit circle. As the angle increases from to , the sine and cosine values move between and .
How the sine graph is created from the unit circle
The graph of is derived directly from the unit circle. As we move around the circle through different values of , we can track how the -coordinate (which equals ) changes.
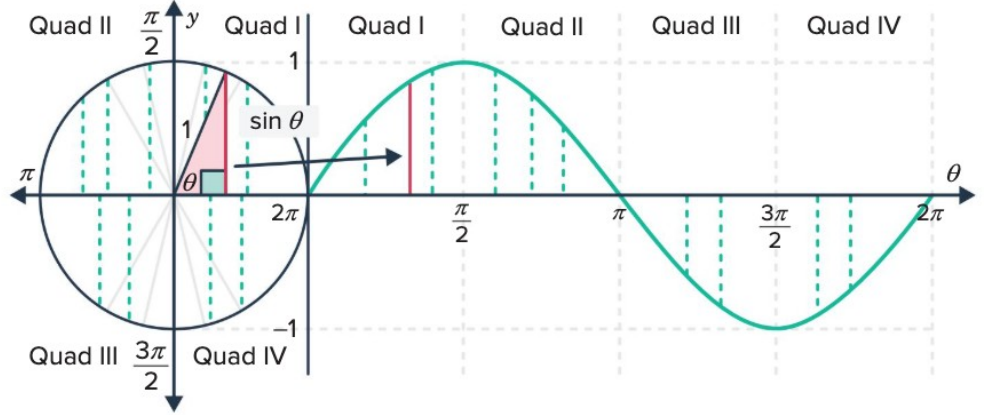
This diagram shows how points on the unit circle correspond to points on the sine wave. The vertical dashed lines connect matching values between the circle and the graph. Notice how the sine value starts at when , rises to a maximum of at , returns to at , drops to a minimum of at , and completes the cycle back at when .
The complete sine function graph
Since sine is a circular function derived from the unit circle, it repeats its pattern indefinitely in both directions along the horizontal axis.
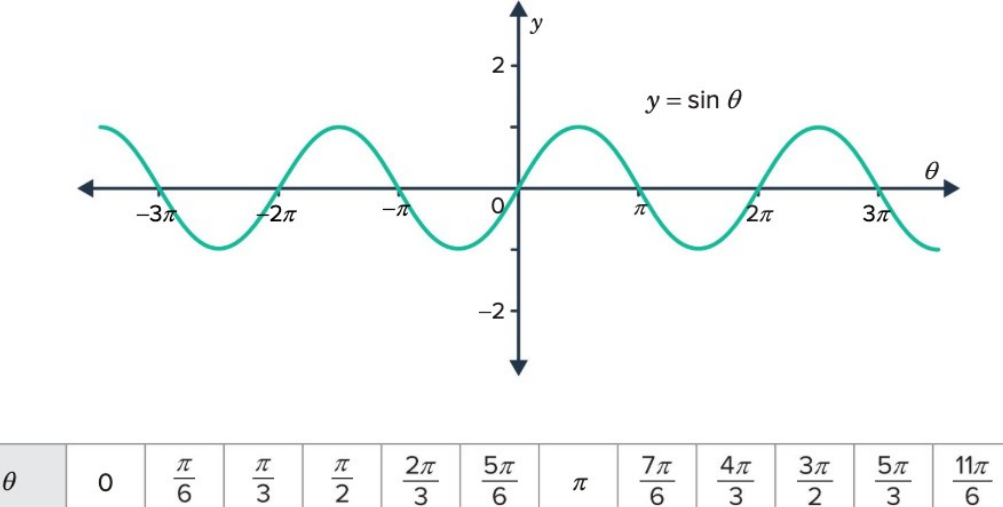
The graph shows the characteristic wave shape of the sine function. The smooth, continuous curve oscillates between and , crossing through zero at multiples of .
How the cosine graph is created from the unit circle
Similarly, the cosine function can be visualized through the unit circle by tracking the -coordinate as the angle changes.
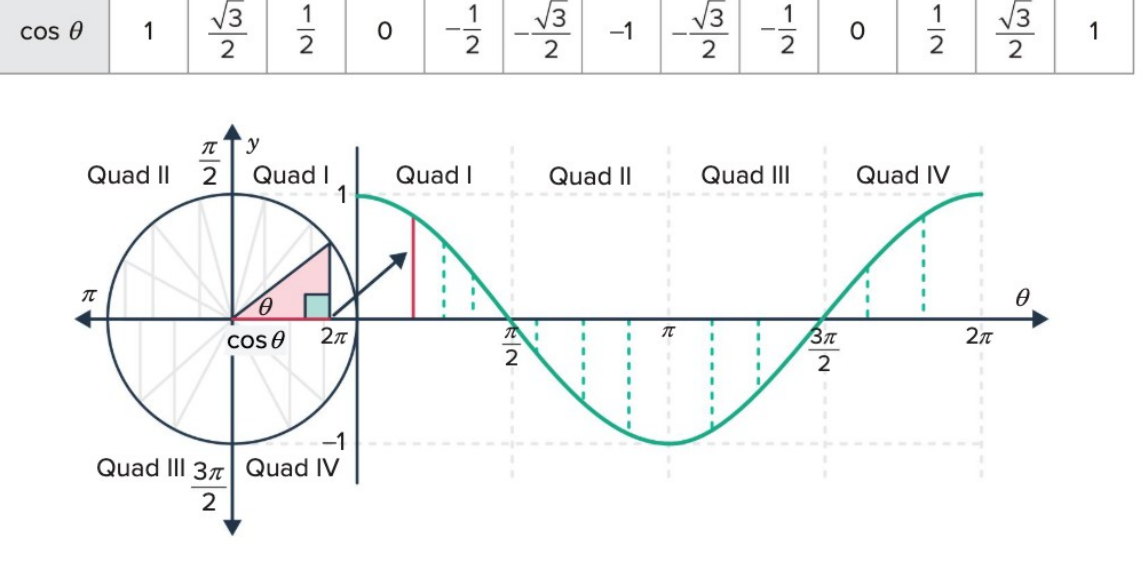
The cosine graph has the same wave shape as the sine graph, but it starts at a different position. When , cosine equals (its maximum value), whereas sine equals .
The complete cosine function graph
The graph of extends infinitely in both directions, repeating every units.
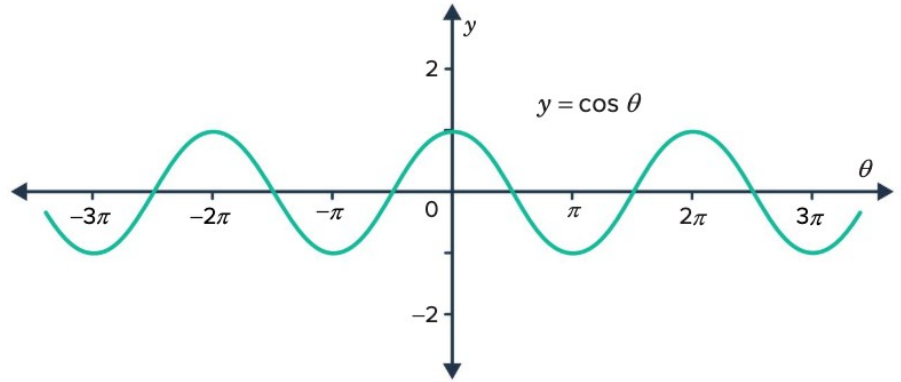
Both sine and cosine functions have similar properties and are described as circular functions or periodic functions. The term "circular" reflects their origin from the unit circle, while "periodic" describes how they repeat at regular intervals.
Key terminology: period
A crucial concept when studying trigonometric graphs is the period.
Definition: Period
A function is periodic with period if for all . This means the function repeats itself after each interval of length .
For example, and both have period .
The period represents the length of one complete cycle in the graph. This is typically measured from a consistent reference point, such as from one peak to the next peak, or from one rising intercept to the next rising intercept.
For the sine and cosine functions, the period of corresponds to one full revolution around the unit circle. After rotating through radians, we return to the same position on the circle, so the sine and cosine values repeat.
Key terminology: amplitude and midline
In addition to period, the amplitude and midline are important features of trigonometric graphs.
Each graph oscillates around a horizontal line called the midline. For the basic sine and cosine functions ( and ), the midline is the -axis (the line ), since the functions oscillate symmetrically between and .
Definition: Amplitude
A function of the form or has amplitude , which is half the distance between the maximum and minimum values.
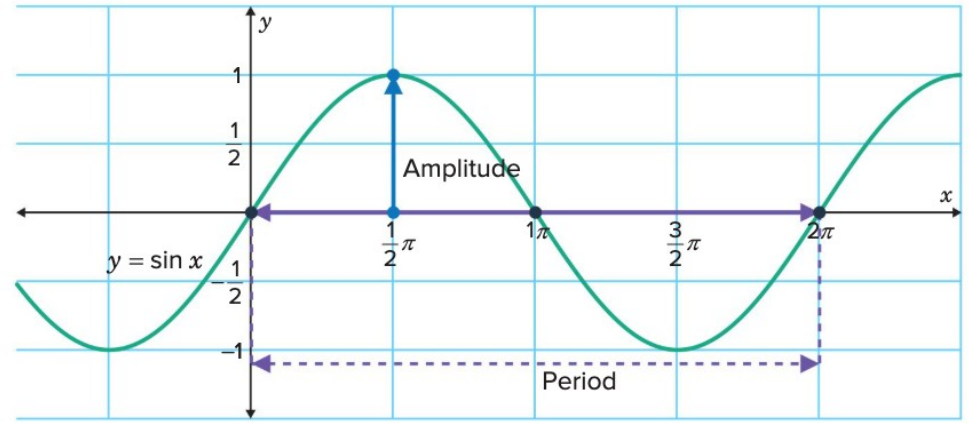
In this diagram, we can clearly see the amplitude and period marked on the sine function. The amplitude of is the vertical distance from the midline () to the maximum point. The period of is the horizontal distance for one complete wave cycle.
For , the maximum value is and the minimum value is , so the amplitude is .
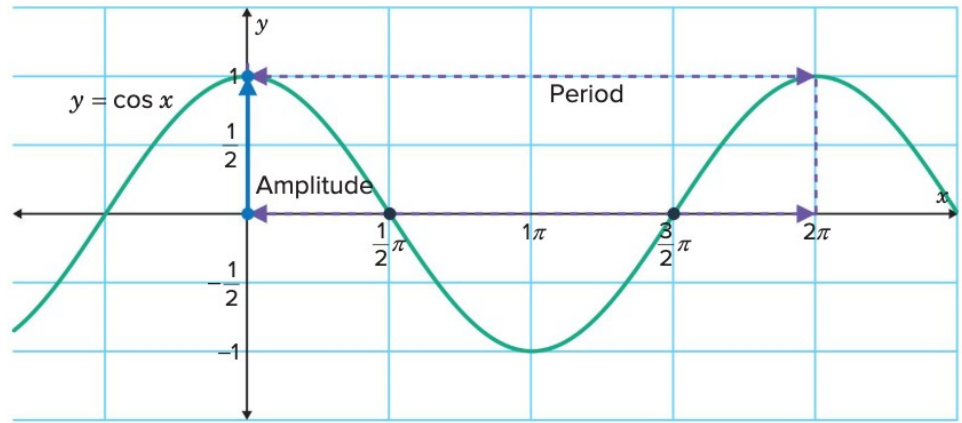
The cosine function has identical amplitude and period to the sine function. The only difference is the starting position of the wave.
Key features of y = sin x
Let's summarize all the important characteristics of the sine function:
Complete Properties of
Period:
- The function repeats every units along the horizontal axis.
Midline:
- The graph oscillates symmetrically above and below the -axis.
Maximum: at , where is an integer
- The highest points on the graph occur at , , , etc.
Minimum: at , where is an integer
- The lowest points occur at , , etc.
Amplitude:
- The vertical distance from the midline to a peak (or trough) is unit.
Domain: All real
- The sine function is defined for every real number.
Range: or
- The output values are always between and , inclusive.
Zeroes (x-intercepts): At , where is an integer
- The graph crosses the -axis at , , , , etc.
Symmetry: The sine function is odd, satisfying
- This means the graph has point symmetry about the origin. If you rotate the graph about the origin, it looks identical.
Key features of y = cos x
Now let's examine the cosine function in the same way:
Complete Properties of
Period:
- Like sine, the cosine function repeats every units.
Midline:
- The graph oscillates symmetrically around the -axis.
Maximum: at , where is an integer
- The peaks occur at , , , etc.
Minimum: at , where is an integer
- The troughs occur at , , , etc.
Amplitude:
- The amplitude is identical to that of the sine function.
Domain: All real
- The cosine function is defined for all real numbers.
Range: or
- The output values always lie between and .
Zeroes (x-intercepts): At , where is an integer
- The graph crosses the -axis at , , , etc.
Symmetry: The cosine function is even, satisfying
- This means the graph has line symmetry about the -axis. If you reflect the graph across the -axis, it looks identical.
Tangent function
Definition of tangent
The tangent function is defined as the ratio of the sine function to the cosine function:
Definition of Tangent
This ratio also represents the gradient (slope) of the line from the origin to a point on the unit circle.
Understanding the period of tangent
The tangent function has an interesting property related to angles that differ by . When we add to an angle, both the sine and cosine values change sign:
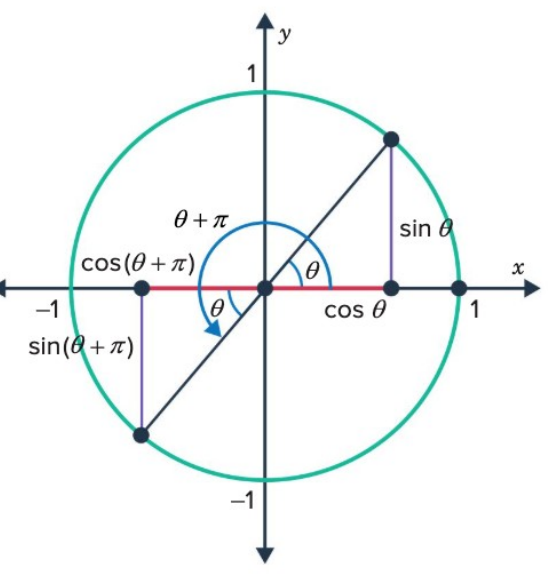
From the unit circle, we can see that:
Worked Example: Proving the Period of Tangent
Using these relationships in the definition of tangent:
Step 1: Substitute the relationships
Step 2: Simplify by canceling the negatives
Conclusion: This shows that the tangent function repeats every units, so its period is (not like sine and cosine).
The graph of y = tan θ
The tangent function has a very different appearance from sine and cosine.
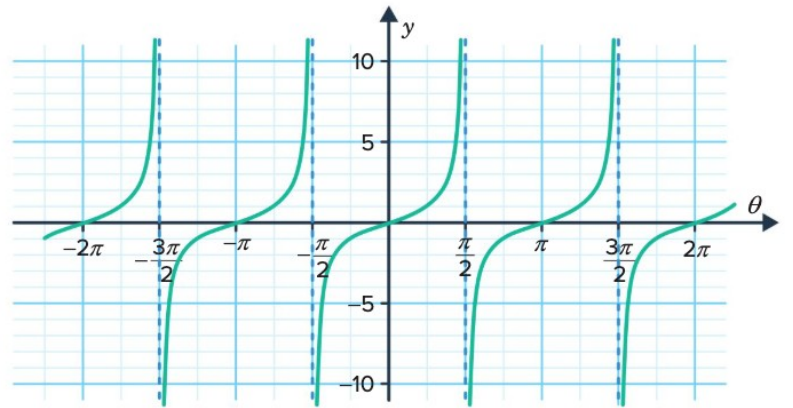
Notice the distinctive features:
- The graph consists of separate curved branches
- Vertical dashed lines show positions where the function is undefined
- The pattern repeats every units
- The function values extend from negative infinity to positive infinity
Key features of the tangent function
Complete Properties of
Vertical asymptotes: At , for any integer
- The function is undefined at these points because at these angles, making the denominator of equal to zero. The graph approaches these vertical lines but never touches them. Examples include , , , , etc.
y-intercept:
- When , we have .
x-intercepts: At , for any integer
- The tangent function equals zero whenever , which occurs at multiples of .
Period:
- The distance between consecutive asymptotes is . The function repeats its pattern every units.
Range: All real numbers or
- Unlike sine and cosine, the tangent function can take any real value. Within each branch between asymptotes, the function increases from negative infinity to positive infinity.
Domain: is real, where for any integer
- The function is undefined at each vertical asymptote.
Key points: The function passes through and
- These points are useful reference points when sketching the tangent graph. When , both and equal , so their ratio equals .
Symmetry: The tangent function is odd, satisfying
- This means the graph has point symmetry about the origin (or about any point of inflection) through a rotation of .
Amplitude: None
- The tangent function does not have an amplitude because it is not bounded; it extends to infinity in both directions.
Midline:
- Although the function doesn't oscillate around this line in the same way as sine and cosine, the -axis serves as a reference line that the function crosses in the middle of each branch.
Key Points to Remember
-
The coordinates of any point on the unit circle at angle are , which directly gives us the cosine and sine values.
-
Both sine and cosine functions have period and amplitude , oscillating between and . The key difference is their starting positions: sine starts at while cosine starts at .
-
Sine is an odd function (point symmetry about the origin), while cosine is an even function (line symmetry about the -axis). This symmetry property helps when evaluating negative angles.
-
The tangent function has period (half that of sine and cosine) and has vertical asymptotes at where the function is undefined.
-
Tangent has no amplitude or maximum/minimum values because its range is all real numbers. It increases from to between consecutive asymptotes.