Pearson’s Correlation Coefficient (HSC SSCE Mathematics Standard): Revision Notes
Pearson's Correlation Coefficient
What is Pearson's correlation coefficient?
When we analyse bivariate data (data with two variables), we often want to know how closely the two variables are related. Pearson's correlation coefficient, denoted by the symbol , is a statistical measure that tells us the strength of a linear relationship between two variables.
The correlation coefficient helps us understand whether two variables move together in a predictable pattern, and if so, how strong that pattern is.
Understanding the correlation coefficient
The range of values
Pearson's correlation coefficient always falls between and :
The closer the value of is to or , the stronger the linear relationship between the variables.
- Values near indicate a strong positive relationship
- Values near indicate a strong negative relationship
- Values near indicate little to no linear relationship
Types of correlation
There are three main types of correlation:
Positive correlation ( to )
- When one variable increases, the other variable also increases
- Similarly, when one variable decreases, the other decreases as well
- Both variables move in the same direction
- Example: As foot length increases, height tends to increase
Zero or no correlation ()
- There is no linear relationship between the variables
- Knowing the value of one variable doesn't help predict the other
- The data points on a scatterplot appear randomly scattered
Negative correlation ( to )
- When one variable increases, the other variable decreases
- The variables move in opposite directions
- Example: As the amount of exercise increases, body weight might decrease
Visual representation of correlation
Looking at scatterplots can help us understand different correlation values. The pattern of points on the graph shows the strength and direction of the relationship.
Understanding Scatterplot Patterns:
The way data points cluster on a scatterplot tells us about the strength and direction of the correlation.
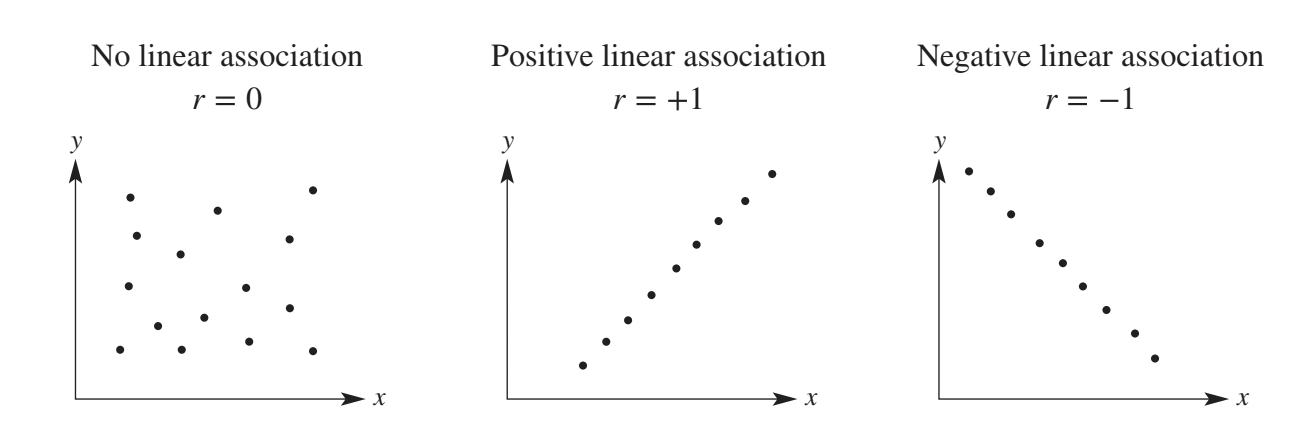
Perfect correlations:
- When : all points lie exactly on a straight line sloping upward
- When : points are scattered randomly with no clear pattern
- When : all points lie exactly on a straight line sloping downward
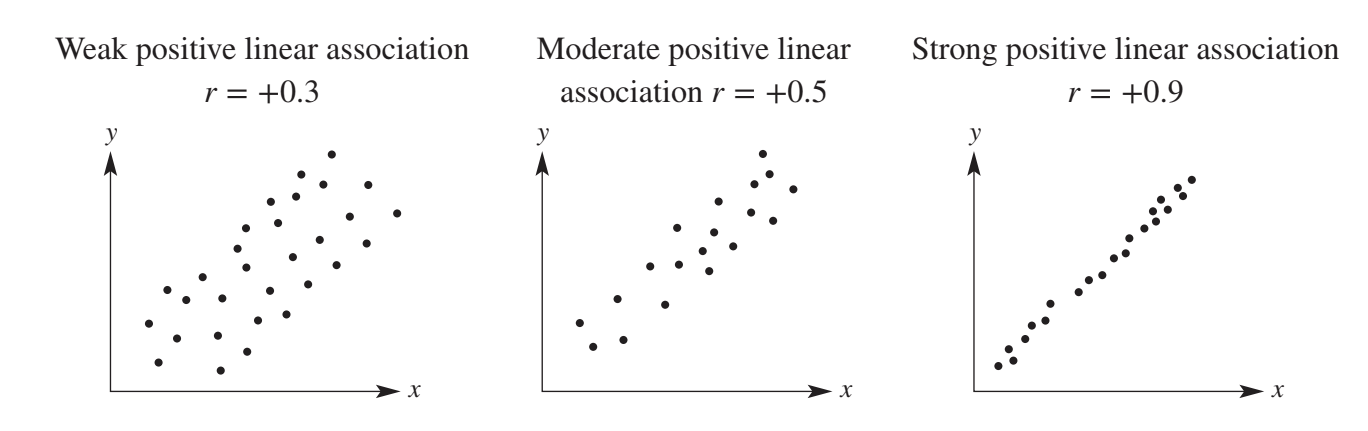
Varying strengths of positive correlation:
- Weak positive (): points show a slight upward trend but are quite scattered
- Moderate positive (): points show a clear upward trend with moderate spread
- Strong positive (): points cluster tightly around an upward sloping line
Classifying the strength of associations
We can classify the strength of a linear association using the value of Pearson's correlation coefficient. The table below provides guidelines for interpretation:
| Association | Pearson's correlation coefficient |
|---|---|
| Strong positive | to |
| Moderate positive | to |
| Weak positive | to |
| No linear association | to |
| Weak negative | to |
| Moderate negative | to |
| Strong negative | to |
Key points about classification:
- Values closer to 0 indicate little or no linear relationship
- Values closer to +1 or -1 indicate stronger relationships
- The sign (positive or negative) tells us the direction of the relationship
- The magnitude (size) tells us the strength of the relationship
Calculating Pearson's correlation coefficient
Modern scientific and graphing calculators can compute Pearson's correlation coefficient quickly and accurately. Here's the general process:
Using a scientific calculator
Step 1: Enter statistics mode
- Access the statistics or data analysis mode on your calculator
Step 2: Select the appropriate regression type
- Choose the linear regression option (often shown as "A + BX" or similar)
Step 3: Enter your data
- Input the first variable's data into List 1
- Input the second variable's data into List 2
- Ensure data pairs are entered in the correct order
Step 4: Calculate the correlation coefficient
- Select the regression calculation option
- Choose to display the correlation coefficient ()
Worked example: foot length and height
Worked Example: Finding and Classifying Pearson's Correlation Coefficient
Problem: The table below shows foot length and height in centimetres for a group of students.
| Foot length (cm) | 24.5 | 25.6 | 26.1 | 25.9 | 26.2 | 27.0 | 27.4 | 27.5 | 28.1 |
|---|---|---|---|---|---|---|---|---|---|
| Height (cm) | 167 | 168 | 170 | 174 | 176 | 180 | 181 | 185 | 187 |
Part a) Find Pearson's correlation coefficient.
Part b) Classify the strength of the association.
Solution:
Part a) Finding the correlation coefficient:
Following the calculator steps:
-
Enter statistics mode and select linear regression
-
Enter foot length data into List 1:
-
Enter height data into List 2:
-
Calculate regression statistics and display
The calculator gives us:
We can round this to r = 0.95 (to two decimal places).
Part b) Classifying the strength:
-
The value falls in the range to
-
According to our classification table, this indicates a strong positive linear association
Interpretation: There is a strong positive relationship between foot length and height. This means that as foot length increases, height tends to increase as well, and the relationship is very strong (the points would cluster tightly around a line).
Important: correlation vs causation
Critical Point: Correlation Does NOT Mean Causation
A high correlation between two variables does not mean that one variable causes changes in the other.
Even if two variables are strongly correlated, this doesn't prove a cause-and-effect relationship. There could be other explanations:
- Both variables might be influenced by a third factor
- The relationship might be coincidental
- The correlation might only be true for the specific data set examined
Example: Ice cream sales and drowning incidents are positively correlated, but ice cream doesn't cause drowning. Both increase in summer due to hot weather (the third factor).
Always be careful when interpreting correlation results. Statistical association is different from causation.
Remember!
Key Points to Remember:
-
Pearson's correlation coefficient () measures the strength and direction of a linear relationship between two variables, with values ranging from to
-
Positive correlation means both variables move in the same direction, negative correlation means they move in opposite directions, and zero correlation means no linear relationship exists
-
Strong associations have values between and , moderate associations between and , and weak associations between and
-
You can calculate using a scientific or graphing calculator by entering your bivariate data and selecting the regression analysis function
-
Correlation does not imply causation – even if two variables are strongly correlated, this doesn't prove that one causes changes in the other