Reciprocal Functions and Models (HSC SSCE Mathematics Standard): Revision Notes
Reciprocal Functions and Models
Introduction to reciprocal functions
A reciprocal function is a type of mathematical function where the variable appears in the denominator. These functions create curved graphs called hyperbolas.
The general form of a reciprocal function is:
where is a constant number.
Common examples include , , and .
In reciprocal functions, as increases, decreases (or vice versa), showing an inverse relationship between the variables. This is the defining characteristic that makes reciprocal functions useful for modeling real-world situations where quantities work in opposite directions.
Key features of a hyperbola
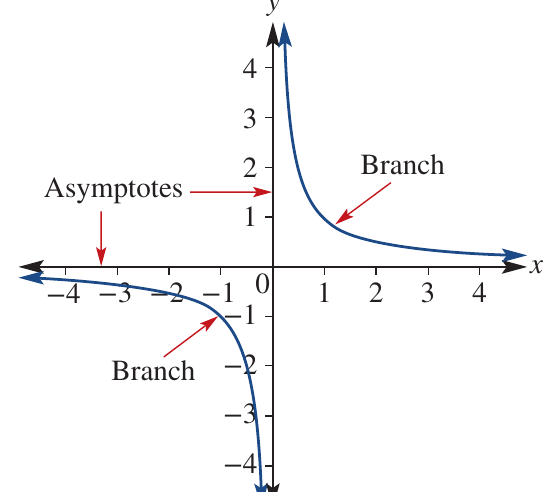
When you graph a reciprocal function, you create a curve called a hyperbola. Hyperbolas have several distinctive characteristics that make them easy to identify.
Undefined at x = 0
No value exists for when because you cannot divide by zero. This creates a gap in the graph at the -axis.
This is a common source of errors - always remember that reciprocal functions are undefined at .
Two branches
The curve has two separate parts called branches. Each branch is the same shape and size, making them symmetrical. The branches appear in opposite quadrants of the coordinate plane.
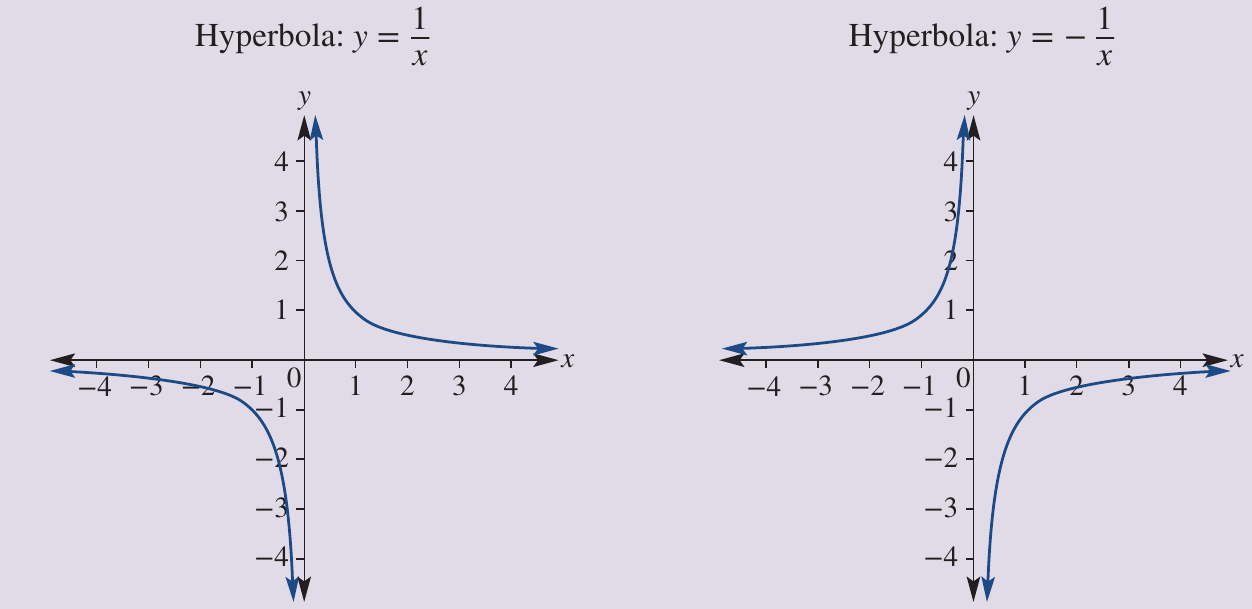
For : The branches appear in the first quadrant (top right) and third quadrant (bottom left).
For : The branches appear in the second quadrant (top left) and fourth quadrant (bottom right).
Asymptotes
Asymptotes are lines that the curve approaches but never actually touches. For basic reciprocal functions, the asymptotes are:
- The -axis (horizontal asymptote):
- The -axis (vertical asymptote):
The curve gets closer and closer to these axes but will never reach them, no matter how far you extend the graph. Think of asymptotes as invisible boundaries that guide the shape of the hyperbola.
Rectangular hyperbola
Because the asymptotes are at right angles to each other (the -axis and -axis are perpendicular), the curve is also called a rectangular hyperbola.
How to graph a hyperbola
To create an accurate graph of a reciprocal function, follow these steps:
- Construct a table of values - Choose several values (both positive and negative) and calculate the corresponding values using the function
- Draw a number plane - Set up your coordinate axes with appropriate scales
- Plot the points - Mark each coordinate pair from your table on the graph
- Join the points - Draw smooth curves through the points to form the two branches of the hyperbola
Remember not to connect points across the -axis, as the function is undefined at . The two branches must remain separate.
Worked example: graphing y = 2/x
Worked Example: Graphing
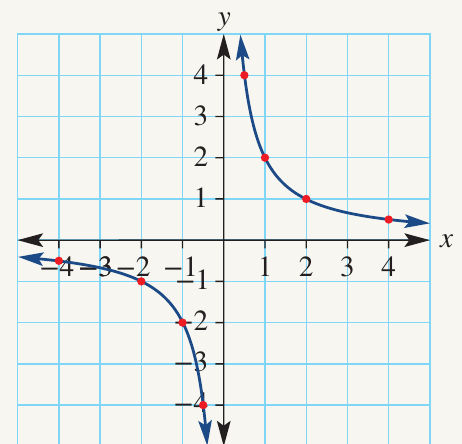
Let's graph the reciprocal function .
Step 1: Create a table of values
Choose values:
Calculate values using :
Step 2: Draw the coordinate plane
Set up your axes with on the horizontal axis and on the vertical axis.
Step 3: Plot the points
Mark these coordinates: , , , , , , ,
Step 4: Join the points
Notice that no value exists when , which creates two separate branches. Draw smooth curves through the points in each quadrant.
Worked example: graphing y = -2/x and identifying asymptotes
Worked Example: Graphing and Identifying Asymptotes
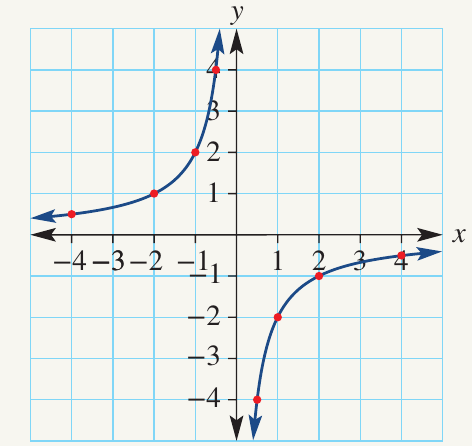
Now let's graph and identify its asymptotes.
Step 1: Create a table of values
Choose values:
Calculate values using :
Step 2: Plot and draw the graph
Following the same process as before, plot the points and join them to form two branches.
Step 3: Identify the asymptotes
The curve approaches both the -axis and -axis but never touches them.
Asymptotes are: and
Exam Tip: When asked to identify asymptotes, always write them as equations (e.g., and ), not just as "the axes" or "horizontal and vertical lines."
Reciprocal models
Reciprocal modelling occurs when we use a reciprocal function to describe a real-world situation mathematically. These models are particularly useful when quantities have an inverse relationship - as one increases, the other decreases.
A reciprocal model has the form:
where is a constant and the variables represent practical quantities like time, speed, cost, or number of people.
Reciprocal models typically show fast growth or decay and are useful for situations involving:
- Speed and time relationships
- Sharing costs among people
- Concentration and dilution
- Intensity and distance
Worked example: road trip time and speed model

Worked Example: Road Trip Time and Speed Model
The time taken () in hours for a road trip at speed () in km/h is given by the reciprocal function:
a) Construct a table of values for and
Choose appropriate speed values:
Calculate time values using :
b) Draw the graph of
- Set up axes with (speed) on the horizontal axis
- Place (time) on the vertical axis
- Plot the coordinate pairs from the table
- Join the points to form one branch of a hyperbola
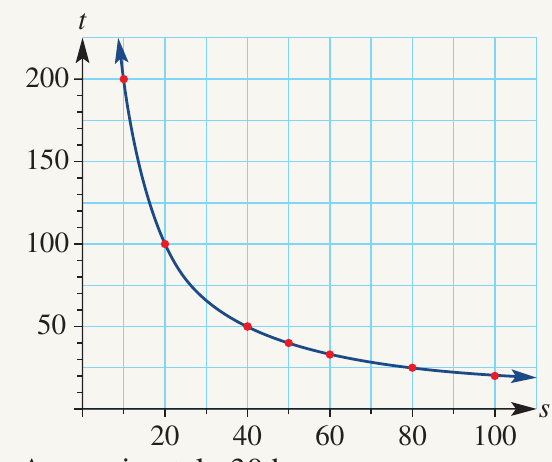
c) How long did the road trip take at a speed of 70 km/h?
Read the graph at . The corresponding value is approximately hours.
Answer: Approximately 30 hours
d) Why is it impossible to complete the road trip in 10 hours?
To find the required speed:
- Substitute into the equation
- Solve for : km/h
Answer: The speed required to complete the trip in 10 hours is 200 km/h, which is above the speed limit on Australian roads, making it impossible to complete legally.
Learning Point: This example shows how reciprocal models can help us understand practical limitations in real-world situations. Always check whether your mathematical answer makes sense in the real-world context.
Worked example: pizza cost sharing model

Worked Example: Pizza Cost Sharing Model
The cost per person () in dollars when sharing a pizza depends on the number of people () eating it. The reciprocal equation is:
a) Describe the possible values for
Since represents the number of people sharing a pizza, it must be:
- A positive whole number (you can't have negative or fractional people)
- Likely less than 10 (for a typical pizza sharing scenario)
Answer: is a positive whole number, likely less than 10
b) Construct a table of values for and
Choose values:
Calculate using :
c) Draw the graph of
- Set up axes with (number of people) on the horizontal axis
- Place (cost per person) on the vertical axis
- Plot the points from the table
- Join them to form one branch of a hyperbola
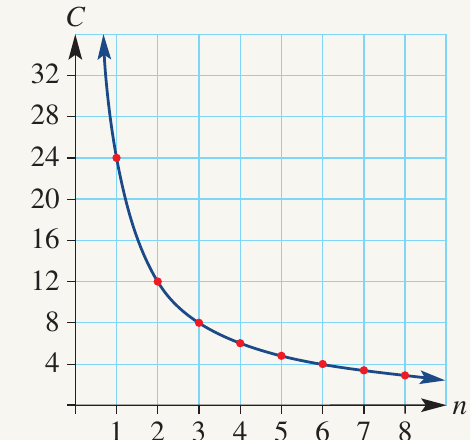
d) What is the cost per person if six people are sharing a pizza?
Read the value from the table or graph when .
Answer: Cost per person is $4
e) How many people shared a pizza if the cost was $2.40 per person?
-
Substitute into the equation:
-
Rearrange to solve for :
-
Calculate:
-
Check this is reasonable (10 people sharing one pizza is possible)
Answer: The number of people sharing the pizza was 10
Exam Tip: When solving reciprocal equations, remember to rearrange the formula by multiplying both sides by the denominator variable, then dividing to isolate the variable you're solving for.
Summary
Key Points to Remember:
- A reciprocal function has the form where is a constant
- Reciprocal functions create hyperbolas with two branches in opposite quadrants
- The graph is undefined at because you cannot divide by zero
- Asymptotes are the -axis () and -axis () - the curve approaches but never touches them
- Reciprocal models describe real-world inverse relationships where as one quantity increases, the other decreases
- To graph a hyperbola: create a table of values, plot points, and join them with smooth curves (keeping branches separate)
- In practical problems, always check that your answer makes sense in the real-world context