Astronomical Applications of Spectroscopy (HSC SSCE Physics): Revision Notes
Astronomical Applications of Spectroscopy
Spectroscopy is a powerful tool that allows astronomers to learn about stars without ever visiting them. By analysing the light from a star, we can determine its temperature, composition, velocity, and other physical properties. This note explores how spectroscopy is applied in astronomy to classify and understand stars.
Historical development of stellar classification
The classification of stars by their spectra began before astronomers fully understood the relationship between spectral patterns and stellar properties. In the 1860s, Italian astrophysicist Angelo Secci was one of the first scientists to declare authoritatively that the Sun is a star. Secci divided the spectra of approximately 4000 stars into five basic groups with subtypes, using the stars' colours and the number of spectral lines in his classification scheme.
Secci's pioneering work in stellar spectroscopy laid the foundation for our modern understanding of stellar classification. His systematic observation of thousands of stars demonstrated that stars could be categorized based on their spectral characteristics, even before the physical principles behind these patterns were fully understood.
The initial classification system used letters A through O based on the strength of visible hydrogen absorption lines (the Balmer series). Stars with the strongest Balmer series lines, which occur at a surface temperature of about , were assigned spectral type A. Cooler red stars with very weak Balmer series lines were assigned type M. Very hot stars with no discernible Balmer series lines were assigned type O.
The absence of hydrogen lines in very hot stars (above ) occurs because hydrogen becomes completely ionised at these temperatures. This means the electron in hydrogen responsible for producing the spectral lines is no longer associated with the hydrogen nucleus (a single proton) and exists instead as a free electron. Without bound electrons, hydrogen atoms cannot produce absorption lines.
Modern spectral classification system
Following observations of black body radiation experiments and laboratory studies of hot gas spectra, astronomers were able to match spectral types to stellar surface temperatures. Black body radiation is the characteristic pattern of electromagnetic radiation emitted by objects due to their temperature.
The original alphabetical order required a complete overhaul. Rather than reassigning all the letters, astronomers simply placed the spectral types in order from hottest to coolest and simplified the system to eliminate overlapping and confusing spectra. This work was mainly completed at Harvard University between 1918 and 1924. The reorganised order, OBAFGKM, is still used today.
Mnemonic: A popular way to remember this sequence is "Oh Be A Fine Girl/Guy Kiss Me".
A tentative new classification for very low mass stars, type L (with temperatures below ), has been suggested more recently. This classification extends our ability to categorize even cooler stellar objects that don't fit neatly into the traditional system.
Key features used in stellar classification
Astronomers now use several key features of a star's spectrum when classifying it:
- The appearance and intensity of spectral lines
- The relative thickness of certain absorption lines
- The wavelength at which peak intensity occurs
These features provide information about the star's temperature, composition, density, and motion.
Determining stellar surface temperature
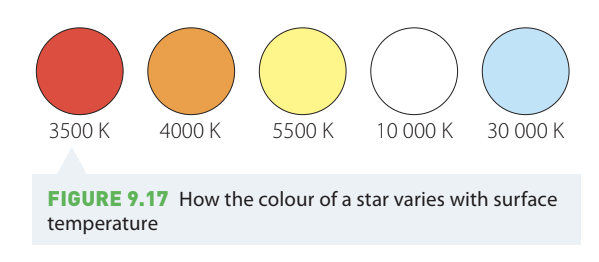
A star is a black body, emitting all frequencies of electromagnetic radiation from its core. As with any incandescent object, the peak wavelength of emitted light indicates the temperature. Therefore, we can determine the surface temperature of a star by its apparent colour.
Temperature and Color Relationship
The relationship between a star's color and its surface temperature follows directly from black body radiation principles. Hotter objects emit radiation that peaks at shorter wavelengths (blue end of the spectrum), while cooler objects peak at longer wavelengths (red end of the spectrum). This allows astronomers to estimate a star's temperature simply by observing its color.
The relationship between colour and temperature is straightforward:
- Cool stars () appear red
- Slightly warmer stars () appear orange
- Sun-like stars () appear yellow
- Hot stars () appear white
- Very hot stars () appear blue
Spectral characteristics of different star types
The following table shows how spectral classes relate to temperature, colour, and spectral features:
| Spectral Class | Effective Temperature (K) | Colour | H Balmer Features | Other Features |
|---|---|---|---|---|
| O | 28000–50000 | Blue | Weak | Ionised He⁺ lines, strong UV continuum |
| B | 10000–28000 | Blue–white | Medium | Neutral He lines |
| A | 7500–10000 | White | Strong | Strong H lines, ionised metal lines |
| F | 6000–7500 | White–yellow | Medium | Weak ionised Ca⁺ |
| G | 4900–6000 | Yellow | Weak | Ionised Ca⁺, metal lines |
| K | 3500–4900 | Orange | Very weak | Ca⁺, Fe, strong molecules, CH, CN |
| M | 2000–3500 | Red | Very weak | Molecular lines (e.g. TiO), neutral metals |
| L? | <2000 | — | — | Tentative new (2000) classification for very low mass stars |
Worked Example: Classifying a Star by Color
If you observe a star through a telescope and it appears distinctly blue-white in color, you can estimate its spectral class and temperature:
Step 1: Identify the color Color observed: Blue-white
Step 2: Match to spectral class From the table, blue-white stars correspond to spectral class B
Step 3: Determine temperature range Temperature range:
Conclusion: This star is likely a B-type star with a surface temperature between and .
Measuring stellar velocity using the Doppler effect
The Doppler effect is the shortening of wavelength of light from a source approaching an observer and the lengthening of wavelengths from sources moving away. This same effect occurs with sound waves—you may have noticed the change in pitch of an emergency vehicle siren as it passes by.
Translational velocity
The relative velocity of a star either approaching or moving away from an observer can be measured by the blue shift or red shift exhibited in the star's spectrum. When a star moves towards us, its spectral lines shift towards shorter wavelengths (blue shift). When it moves away, the lines shift towards longer wavelengths (red shift).
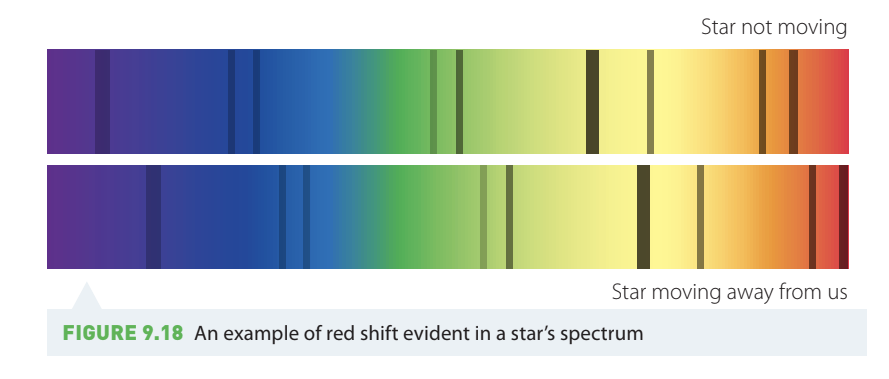
Observing Doppler Shifts in Stellar Spectra
When analyzing a star's spectrum, astronomers compare the observed positions of absorption lines with their known laboratory wavelengths:
Approaching star (blue shift):
- Laboratory wavelength of hydrogen line:
- Observed wavelength:
- Result: Lines shifted to shorter wavelengths → star moving towards us
Receding star (red shift):
- Laboratory wavelength of hydrogen line:
- Observed wavelength:
- Result: Lines shifted to longer wavelengths → star moving away from us
The amount of shift allows calculation of the star's velocity along the line of sight.
Rotational velocity
If a star is rotating, one side moves towards us while the other side moves away. This results in the absorption lines within the spectrum being both red-shifted and blue-shifted simultaneously, causing them to appear broader than expected.
Line Broadening from Rotation
Careful measurement of the amount of line broadening, combined with an estimate of the star's size, allows astronomers to calculate the rotational velocity of the star. Fast-rotating stars show significantly broader spectral lines than slow-rotating or non-rotating stars of the same type. This technique is particularly useful for studying the dynamics of stars and understanding stellar evolution.
Determining stellar density
Knowing the density of a star's atmosphere is very useful for classification. The largest supergiant stars have the lowest densities, while Main Sequence stars have higher densities. Finding both the luminosity class and spectral type of a star allows astronomers to estimate the star's absolute magnitude (the total amount of light the star emits), from which its distance can be calculated.
Density and Spectral Line Width Relationship
Lower density stellar atmospheres produce sharper, narrower spectral lines. This occurs because particles in lower density gases travel further before colliding with other particles. The absorption lines they produce are therefore sharper.
Giant stars have less gravity near their surface, resulting in lower atmospheric pressure. A gas under lower pressure produces finer spectral lines, so giant stars have finer spectral lines than Main Sequence stars of the same spectral type. This difference allows astronomers to distinguish between giants and main sequence stars even when they have the same temperature and color.
Identifying chemical composition
Spectroscopy allows us to determine which elements are present in a star's atmosphere. When continuous radiation from a star's core passes through its outer layers, photons are absorbed by gases and then re-emitted in all directions.
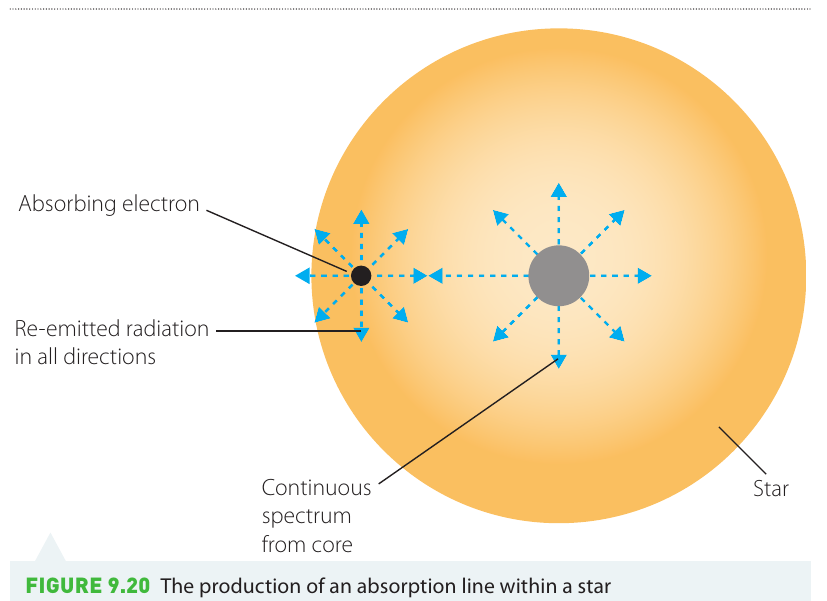
This absorption process creates dark lines at specific wavelengths in the star's spectrum. Each element produces its own characteristic pattern of absorption lines, acting like a unique fingerprint. By analyzing these patterns, astronomers can identify the chemical elements present in stars thousands of light-years away.
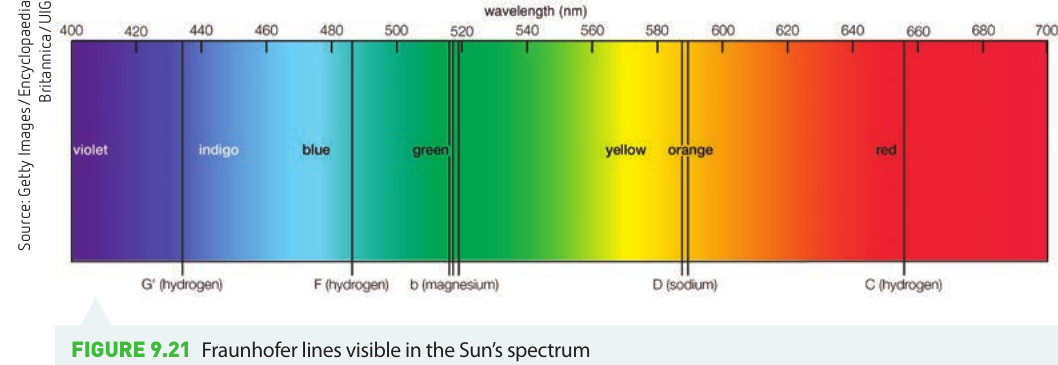
Fraunhofer lines
Stars like the Sun have small quantities of many elements in their atmospheres, including calcium, potassium, and iron. Fraunhofer lines are named after Joseph von Fraunhofer, who carefully observed the Sun's absorption lines in the 1800s. These dark lines are due to the many elements absorbing radiation at particular wavelengths.
Identifying Elements in a Stellar Spectrum
To determine which elements are present in a star's atmosphere:
Step 1: Obtain the star's spectrum Record the wavelengths of all visible absorption lines (dark lines)
Step 2: Compare with laboratory spectra Match the observed absorption lines with known patterns from laboratory measurements of different elements
Step 3: Identify matching patterns If a star shows absorption lines at wavelengths matching hydrogen's Balmer series (, , , etc.), then hydrogen is present in the star's atmosphere
Step 4: Determine abundance The relative intensity of the absorption lines indicates the abundance of that element—stronger lines indicate higher concentrations of the element.
For example, if iron absorption lines are particularly strong compared to other elements, this indicates a high abundance of iron in the star's atmosphere.
Key Points to Remember:
-
The spectral classification sequence OBAFGKM orders stars from hottest (O-type, blue) to coolest (M-type, red), with a tentative L-type for very cool stars.
-
A star's surface temperature can be determined from its colour because stars are black bodies—blue stars are hottest () while red stars are coolest ().
-
The Doppler effect causes blue shift in light from approaching stars and red shift from receding stars; rotating stars show broadened spectral lines due to simultaneous red and blue shifts from opposite sides.
-
Lower density stellar atmospheres (like those of giant stars) produce sharper, narrower spectral lines, while higher density atmospheres produce broader lines.
-
Chemical composition is determined by matching absorption lines in a star's spectrum with laboratory spectra of known elements, with line intensity indicating elemental abundance.