High-Performance Liquid Chromatography (VCE SSCE Chemistry): Revision Notes
High-Performance Liquid Chromatography
Introduction to chromatography
Chromatography is a powerful analytical technique used to separate and identify the components within a mixture. This method is essential for determining both the composition and purity of different substances.
Key principles of chromatography
The separation process in chromatography relies on two distinct phases:
Mobile phase: This is the moving phase that carries the sample through the system. It can exist as either a liquid or a gas, depending on the type of chromatography being used.
Stationary phase: This is the non-moving phase that remains fixed in place. It can be either a solid material or a liquid coated onto a solid support.
The interaction between these two phases is the fundamental principle that enables chromatographic separation. Different components in a mixture will interact differently with each phase based on their chemical properties.
How separation occurs
The separation of components happens through a continuous cycle of interactions:
- Adsorption: Components in the mobile phase temporarily stick to the stationary phase
- Desorption: Components then release from the stationary phase and dissolve back into the mobile phase
- Repeated cycling: This process repeats many times as the sample moves through the system
The key to successful separation is that different components undergo adsorption and desorption at different rates. This variation occurs because each component has a different polarity, which affects how strongly it interacts with both the mobile and stationary phases.
Components that adsorb strongly to the stationary phase move more slowly through the system, while those that dissolve readily in the mobile phase move more quickly. This difference in movement rates causes the components to separate from each other.
Column chromatography
Column chromatography is a technique that uses a vertical glass tube filled with a solid stationary phase to separate mixtures.
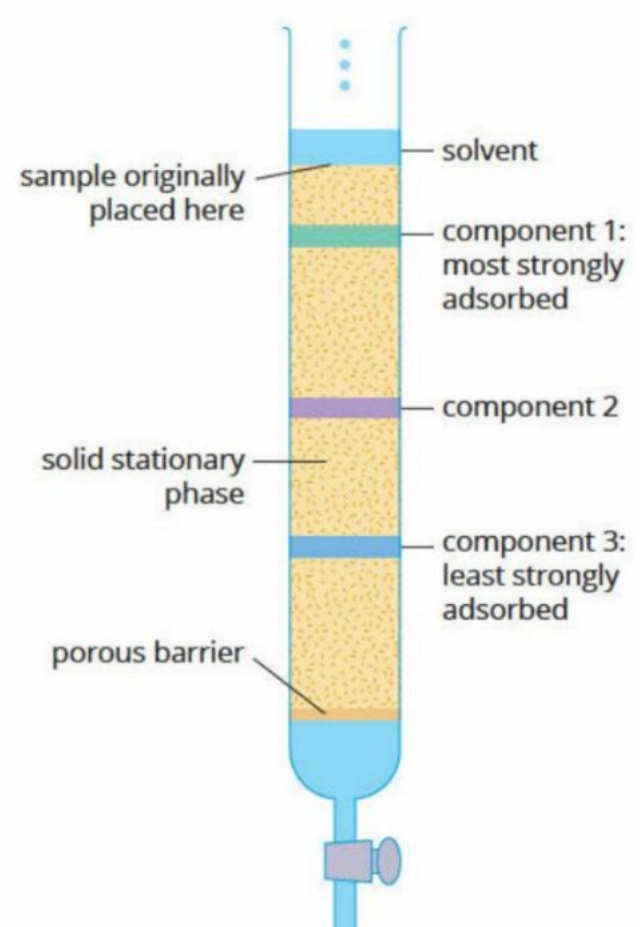
Setup and operation
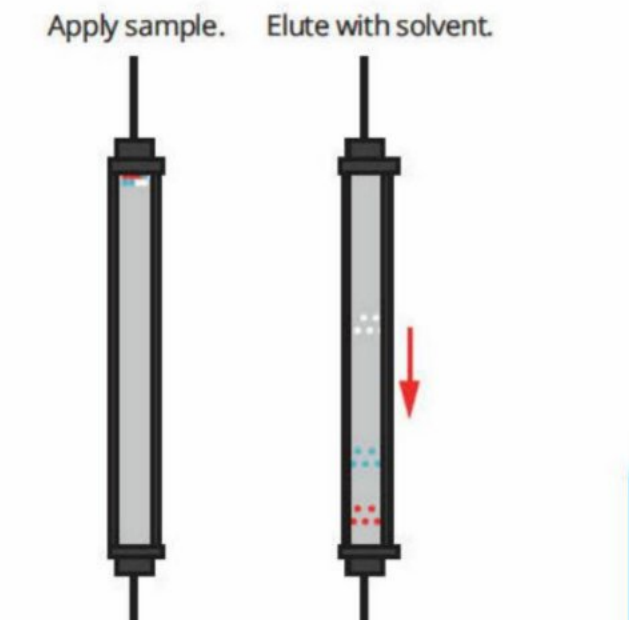
In column chromatography, the solid stationary phase (such as silica or alumina) is packed into a glass column. The sample mixture is carefully applied to the top of this packed solid material. A solvent, which serves as the mobile phase, is then slowly dripped onto the column from a reservoir positioned above it.
At the bottom of the column, a tap controls the flow rate, allowing the solvent (now called the eluent) to leave the column at the same rate it enters from the top. This controlled flow ensures steady movement through the system.
Separation process
As the mobile phase carries the components down the column, each component repeatedly adsorbs onto the stationary phase and then desorbs back into the mobile phase. Because different components have different polarities, they undergo these processes to varying degrees. This causes the components to separate into distinct bands as they move downwards through the column.
Retention time
The retention time () is the time it takes for a specific component to pass completely through the column. This value is characteristic of each component under the specific experimental conditions used (such as temperature, mobile phase composition, and stationary phase type). The retention time in column chromatography serves a similar purpose to the (retardation factor) value used in paper chromatography and thin-layer chromatography.
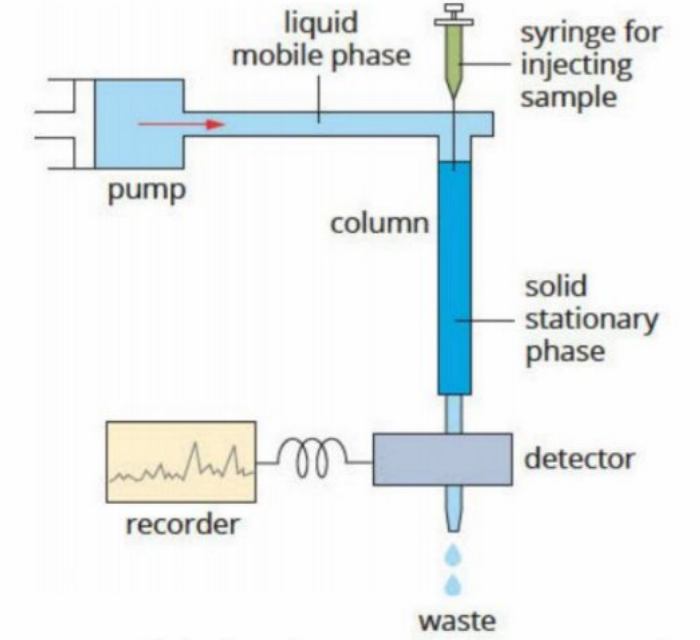
High-performance liquid chromatography (HPLC)
High-performance liquid chromatography (HPLC) is a modern, sophisticated instrumental technique based on the principles of column chromatography. It is sometimes also called high-pressure liquid chromatography, reflecting the high pressures used in the technique.
- Drugs in blood samples
- Hydrocarbons in oil samples
- Proteins in biological fluids
One of the most impressive features of HPLC is its exceptional sensitivity. It can detect and identify compounds present in trace concentrations as low as parts per trillion (ppt), making it an invaluable tool in forensic science, pharmaceutical analysis, and environmental monitoring.
Key differences between column chromatography and HPLC
While HPLC is based on column chromatography, several important differences make it much more powerful:
Particle size: The particles used in the HPLC stationary phase are typically 10-20 times smaller than those used in traditional column chromatography. Most HPLC columns use particles with diameters between 3 and 5 micrometres (m). This dramatically increased surface area allows for more frequent adsorption and desorption of components, resulting in much better separation of similar compounds.
Pressure: The tiny particle size creates considerable resistance to the flow of the mobile phase. To overcome this resistance and maintain a steady flow rate, the solvent must be pumped through the column under high pressure. This is why the technique is sometimes called high-pressure liquid chromatography.
Stationary phases in HPLC
A variety of solid materials can serve as the stationary phase in HPLC columns. Common options include:
- Alumina ()
- Silica ()
- Modified solids with chemicals bonded to their surfaces to improve separation of specific compound classes
Reversed-phase HPLC
The most commonly used form of HPLC is called reversed-phase HPLC. In this approach, the stationary phase is silica that has been chemically modified to make it non-polar. This modification involves attaching long hydrocarbon chains to the surface of the silica particles.
The mobile phase in reversed-phase HPLC is a polar solvent, such as a mixture of water and methanol. This combination of a non-polar stationary phase and polar mobile phase is the reverse of traditional chromatography (hence the name "reversed-phase").
How reversed-phase HPLC separates compounds
The separation in reversed-phase HPLC depends on the polarity of the components in the sample:
Polar molecules: These form relatively strong hydrogen bonds and dipole-dipole attractions with the polar solvent molecules. However, they only weakly adsorb to the non-polar stationary phase. As a result, polar molecules spend most of their time moving with the solvent and pass through the column quickly.
Non-polar compounds: These tend to adsorb strongly to the non-polar stationary phase through dispersion forces (also called London forces or van der Waals forces). They are also less soluble in the polar mobile phase because they cannot form hydrogen bonds with it. Consequently, non-polar compounds spend less time in solution and move through the column more slowly than polar molecules.
This difference in behaviour allows reversed-phase HPLC to effectively separate mixtures of compounds with varying polarities. Polar molecules elute first, followed by increasingly non-polar compounds.
Detection in HPLC
The components exiting the HPLC column are detected by passing the eluent stream through a beam of ultraviolet (UV) light. Many organic compounds naturally absorb UV light, making this an effective detection method.
When an organic compound passes in front of the UV beam, it absorbs some of the light. This causes a reduced signal to be picked up by the detector positioned on the other side of the beam. The detector converts the amount of light received into an absorbance measurement.
This absorbance data is then recorded either on a chart that moves at a constant speed or, more commonly today, on a computer. The resulting trace is called a chromatogram.
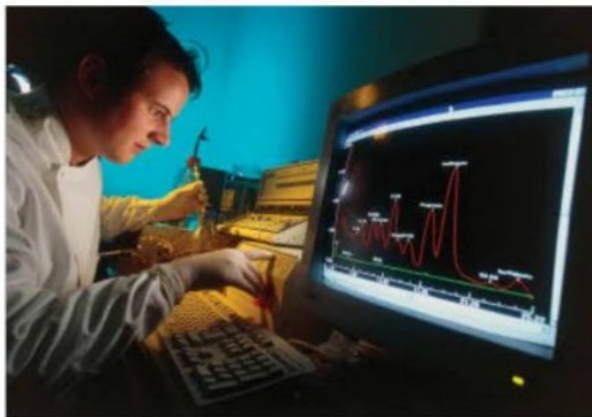
The chromatogram provides both qualitative and quantitative information. The size of each peak corresponds to the amount of light absorbed by that component, which relates directly to the concentration of the component in the mixture. This allows chemists to calculate the relative amounts of different components present.
Applications of HPLC
Chemists use HPLC to answer two fundamental questions about a sample:
- What chemicals are present? (qualitative analysis)
- How much of each chemical is present? (quantitative analysis)
Qualitative analysis
Qualitative analysis involves identifying which compounds are present in a sample. In HPLC, identification relies on retention times.
Using retention times
A key principle of HPLC is that the same compound will always give the same retention time when analysed under identical conditions (same temperature, mobile phase, stationary phase, flow rate, pressure, etc.). Each component in a mixture produces one peak in the chromatogram.
The peaks in a chromatogram can be tentatively identified by comparing them with peaks from known reference compounds. To do this, a sample containing a known pure compound (such as insulin) is run through the HPLC system under exactly the same conditions as the unknown sample.
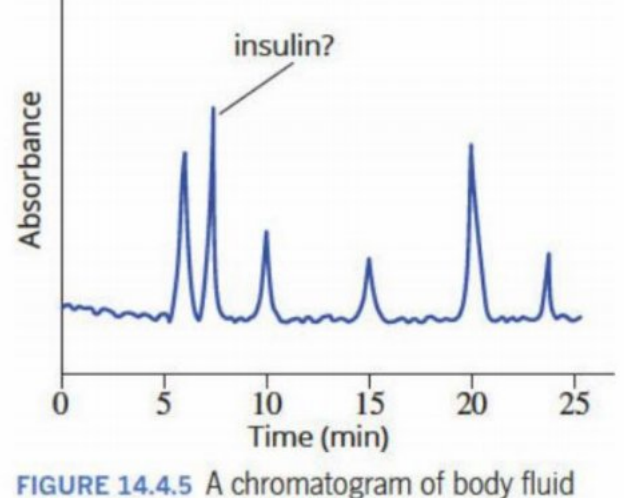
In the chromatogram shown above, several peaks appear at different retention times. The peak labelled as "insulin?" appears at approximately 7 minutes. To confirm whether this is actually insulin, we need to compare it with a reference sample.
Comparison with reference standards
By running a pure insulin sample under identical conditions, we can obtain a reference chromatogram:
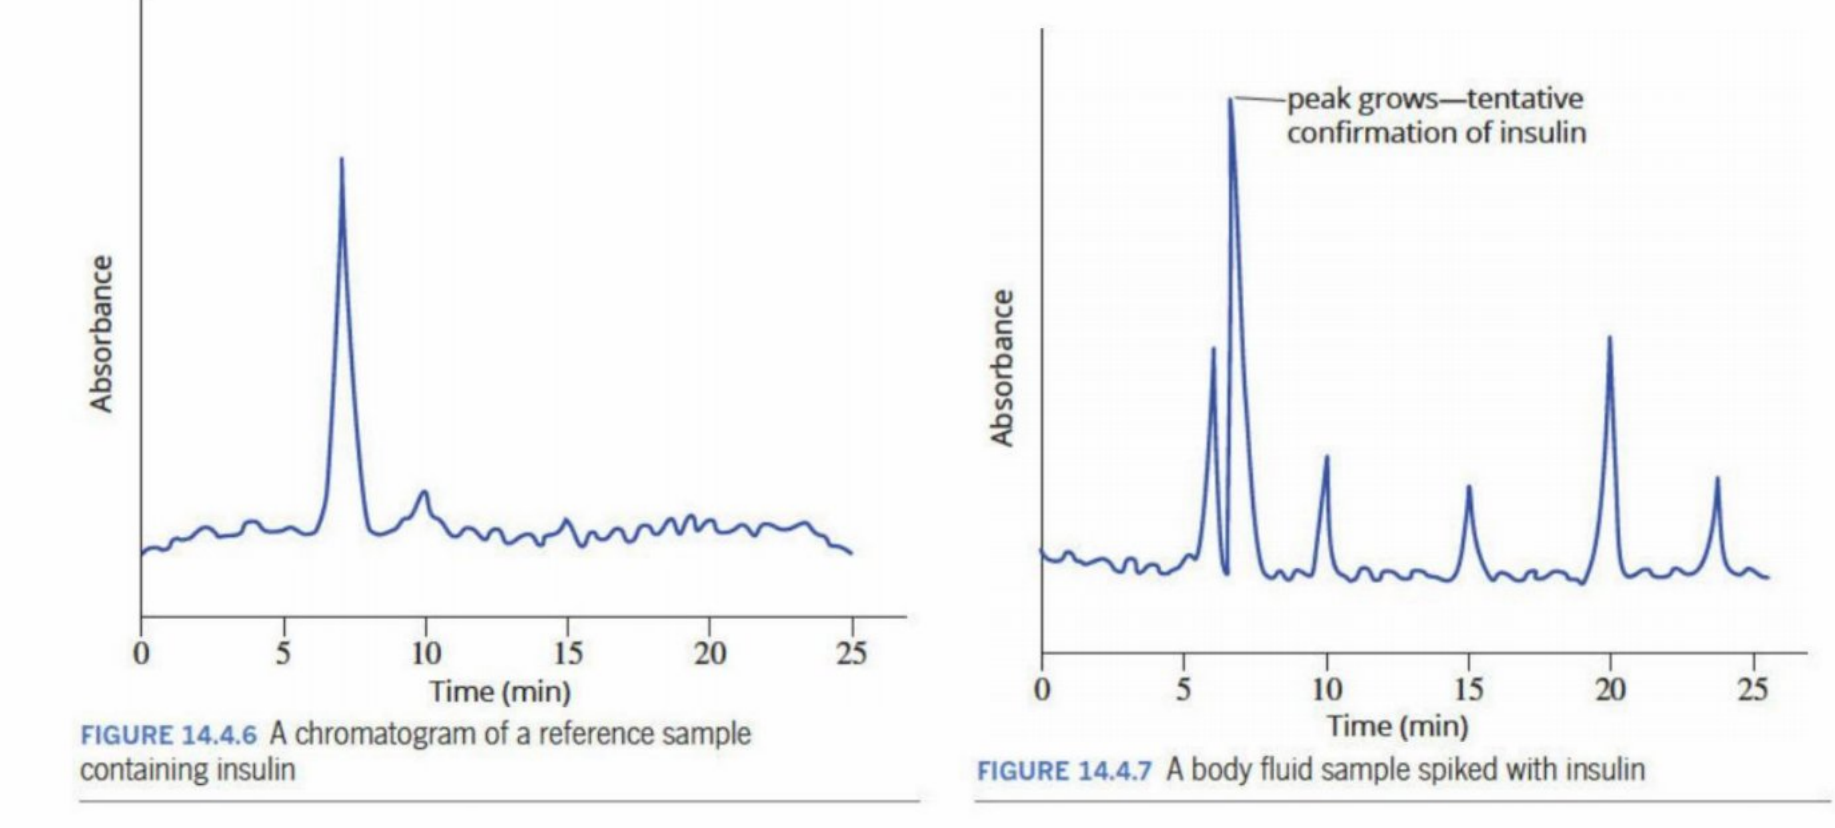
The left chromatogram shows a reference sample containing pure insulin, which produces a sharp peak at approximately 7 minutes. This matches the retention time of the suspected insulin peak in the body fluid sample, providing tentative evidence that insulin is present.
Spiking to confirm identity
A more convincing method of identification is spiking, which involves adding a known compound to the sample and reanalysing it. The right chromatogram above shows the body fluid sample after insulin has been added to it (spiked).
When the spiked sample is analysed, the peak at approximately 7 minutes has grown larger compared to the unspiked sample. Importantly, no new peaks have appeared. This strongly suggests that insulin was already present in the original sample, because if the compound at 7 minutes had been something else, we would see both the original peak and a new peak for the added insulin.
Quantitative analysis
Quantitative analysis determines the concentration of specific components in a mixture. This is achieved by comparing peak areas from the sample with peak areas from standard solutions.
A standard solution is a solution with an accurately known concentration. By preparing several standard solutions at different concentrations and measuring their peak areas, we can construct a calibration curve.
Creating a calibration curve
The calibration curve is a graph that plots peak area (y-axis) against concentration (x-axis) for the standard solutions. Once this curve is established, it can be used to determine the concentration of the same component in unknown samples by measuring their peak areas.
Let's examine a worked example to see how this process works in practice.
Worked example: Caffeine concentration in an energy drink
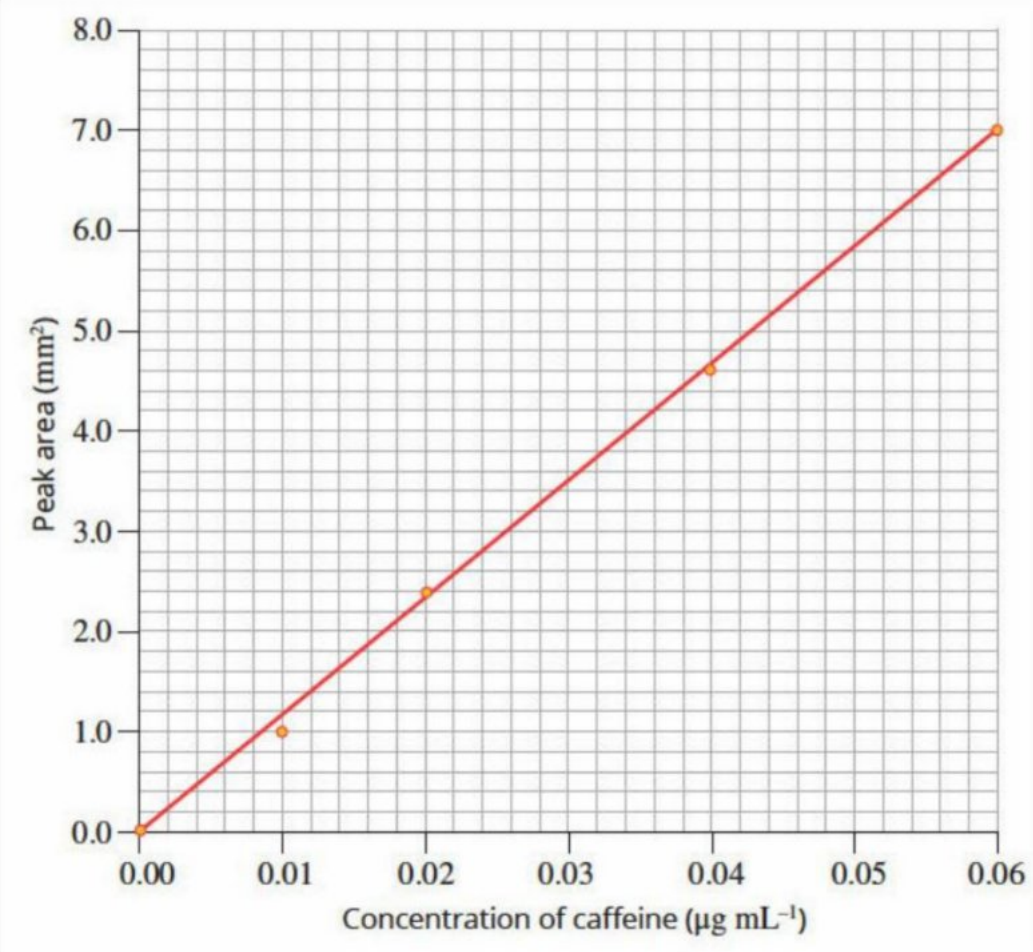
Problem: The concentration of caffeine in an energy drink was determined by HPLC. Chromatograms of standards with accurately known concentrations of caffeine were obtained under the same conditions as the sample. The peak areas are shown in the table below. Calculate the concentration of caffeine in the sample.
| Caffeine standards (g mL) | Peak area (mm) |
|---|---|
| 0.010 | 1.0 |
| 0.020 | 2.4 |
| 0.040 | 4.6 |
| 0.060 | 7.0 |
| sample | 3.5 |
Step 1: Construct a calibration curve by plotting peak area versus concentration for the standard solutions.
Step 2: Use the calibration curve to find the concentration corresponding to the sample's peak area.
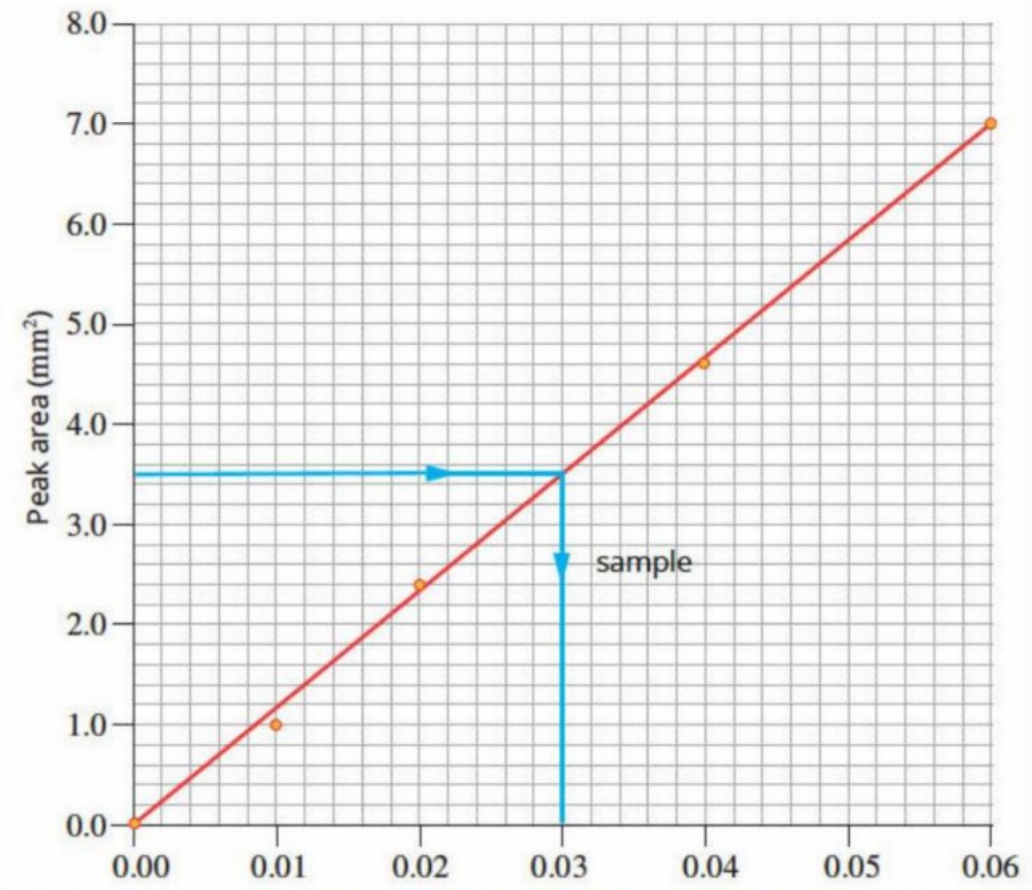
The sample has a peak area of 3.5 mm. To find its concentration, we:
- Locate 3.5 on the y-axis (peak area)
- Draw a horizontal blue line to the calibration curve
- From the point where this line meets the curve, draw a vertical blue line down to the x-axis
- Read the concentration from the x-axis
Answer: The concentration of caffeine in the energy drink is 0.030 g mL.
This method of using calibration curves is standard practice in analytical chemistry and provides accurate, reliable concentration measurements.
Case study: Making the grade
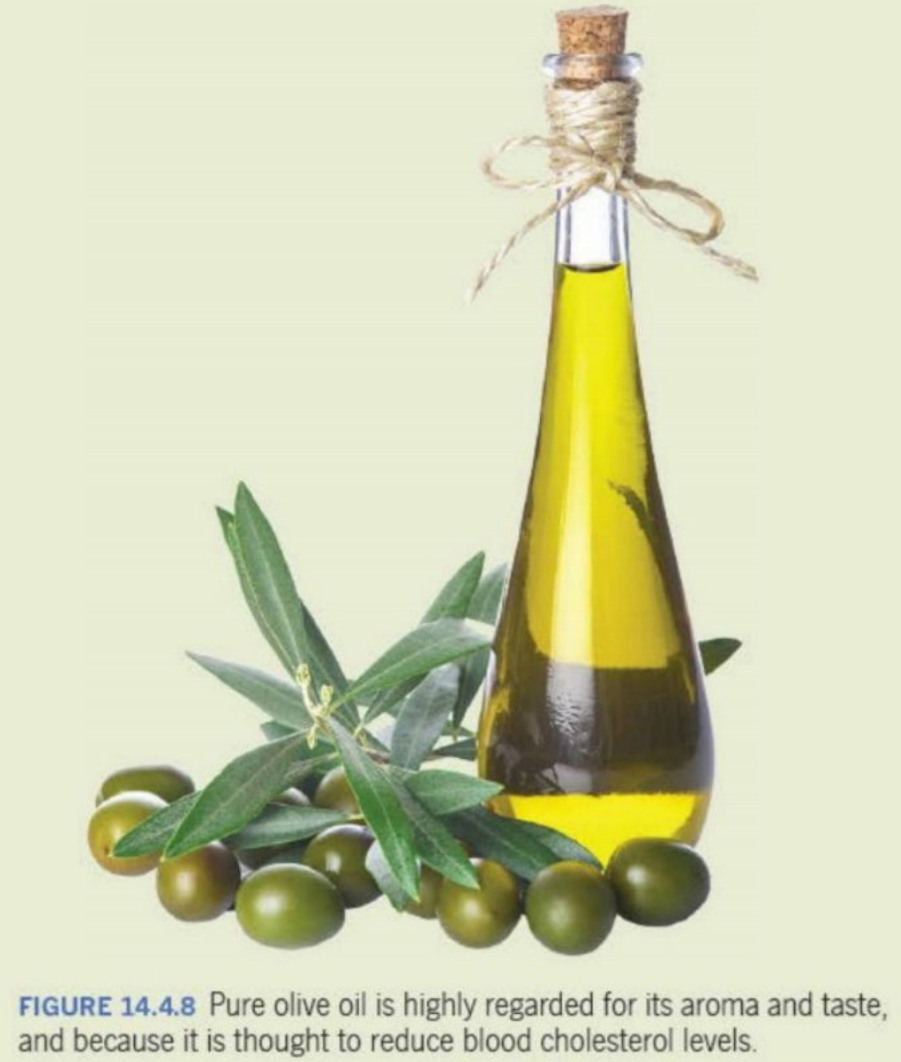
Olive oil is highly valued by gourmet cooks for its distinctive taste and aroma. Nutritionists also favour it because it is rich in monounsaturated triglycerides, which are believed to lower blood cholesterol levels and reduce the risk of heart disease.
However, some companies that process and distribute olive oil succumb to the temptation to mix their olive oil with less expensive oils, such as corn, peanut, and soybean oil. This adulteration increases their profit margins but deceives consumers and may affect the health benefits of the product.
Detection of olive oil adulteration
A European company sent a shipment of olive oil to the United States. During routine inspection, a sample was taken and forwarded to chemist Richard Flor at the US Customs Service laboratory in Washington, DC. The sample looked and poured like olive oil, but it didn't taste quite right.
Because taste is a subjective test and doesn't always stand up in court as evidence, Flor and his colleague Le Tiet Hecking developed an analytical test based on olive oil's unique chemical composition. They used HPLC to separate the oils into their component triglycerides.
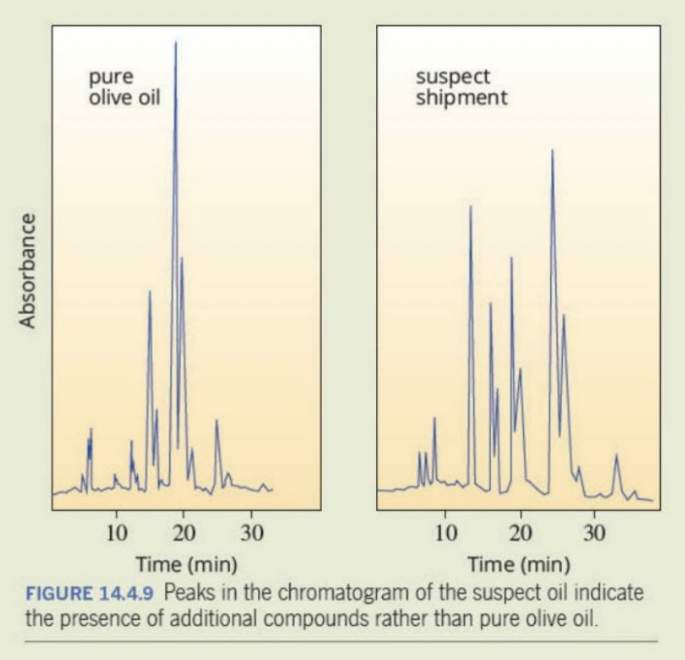
The chromatograms above compare pure olive oil (left) with the suspect shipment (right). Pure olive oil shows one dominant peak around 20 minutes, representing its characteristic monounsaturated triglycerides. The suspect shipment shows multiple peaks of varying heights, indicating the presence of additional compounds not found in pure olive oil.
Flor and Hecking found that the oil in the suspect sample had too much of the polyunsaturated triglycerides. This confirmed their suspicion that the imported sample was diluted with a less expensive oil, likely corn or soybean oil, which are rich in polyunsaturated triglycerides.
Why organic solvents are used in oil analysis
When analysing oils by HPLC, organic solvents like hexane are much more suitable than water for use as the mobile phase. This is because oils and their component triglycerides are non-polar molecules. According to the principle "like dissolves like", non-polar substances dissolve best in non-polar solvents.
Water is a highly polar solvent and would not effectively dissolve or transport the non-polar oil components through the HPLC column. Hexane, being a non-polar organic solvent, ensures that the oil components remain dissolved in the mobile phase and can be properly separated and detected.
Quantitative analysis of adulteration
The case study demonstrates how HPLC can be used not only to detect adulteration but also to quantify it. By comparing peak areas from the suspect sample with those from standard solutions of corn oil components, analysts can determine exactly how much adulterant is present.
For example, if a government department analysed imported olive oil and found it contained chemicals found only in corn oil, they could use a calibration curve approach (similar to the caffeine example above) to determine the exact percentage of corn oil in the mixture.
This type of quantitative analysis provides concrete evidence for legal proceedings and helps protect consumers from fraudulent products.
Summary
Key Points to Remember:
-
HPLC is based on column chromatography but uses much smaller particles (3-5 m) in the stationary phase and high pressure to pump the mobile phase through.
-
Reversed-phase HPLC uses a non-polar stationary phase (modified silica with hydrocarbon chains) and a polar mobile phase (such as water/methanol). Polar molecules elute faster than non-polar molecules.
-
Qualitative analysis identifies components using retention times, comparison with reference standards, and spiking techniques.
-
Quantitative analysis determines concentrations by comparing peak areas with calibration curves constructed from standard solutions.
-
HPLC is extremely sensitive and can detect compounds at concentrations as low as parts per trillion, making it invaluable for forensic science, drug testing, and quality control.