Infrared Spectroscopy (VCE SSCE Chemistry): Revision Notes
Infrared Spectroscopy
Introduction to spectroscopy
Spectroscopy is a powerful analytical technique that uses electromagnetic radiation to provide information about the structure and composition of materials. The technique relies on the interaction between electromagnetic radiation and atoms or molecules. The nature of this interaction depends on the energy of the radiation used.
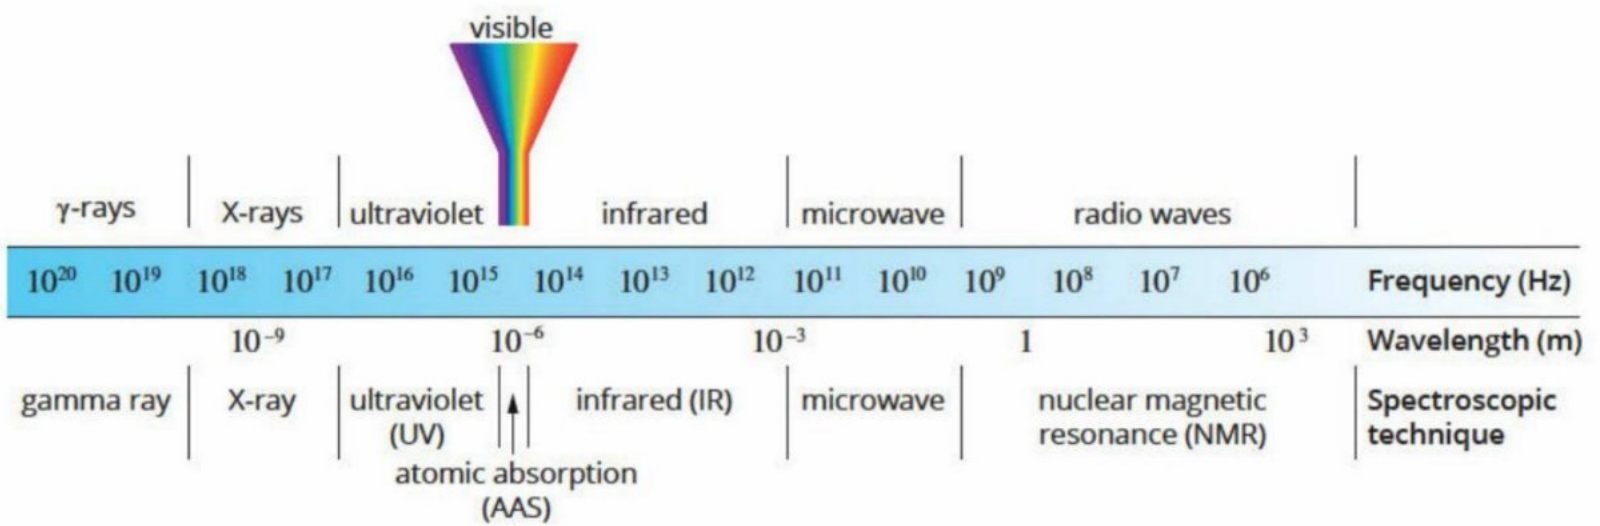
The electromagnetic spectrum consists of different regions of radiation, each characterised by different frequencies, wavelengths, and energies. Ultraviolet light has short wavelengths with high frequency and high energy. In contrast, radio waves have long wavelengths with low frequency and low energy. Between these extremes lie other regions including X-rays, visible light, infrared, and microwaves.
Atoms and molecules possess different types of energy. A water molecule, for example, has four main types of energy in order of increasing magnitude: translational energy (movement through space), rotational energy (spinning motion), vibrational energy (bond bending and stretching), and electronic energy (energy of electrons in orbitals).
Each spectroscopic technique corresponds to a specific region of the electromagnetic spectrum and probes a particular type of energy transition:
| Spectroscopic technique | Region of electromagnetic spectrum | Type of energy transition |
|---|---|---|
| Nuclear magnetic resonance (NMR) spectroscopy | Radio waves | Nuclear spin states in an applied magnetic field |
| Infrared (IR) spectroscopy | Infrared | Vibrations of bonds in molecules (bending and stretching) |
| Colorimetry, UV-visible spectroscopy | Visible and ultraviolet | Valence electrons in molecules and atoms (electron transitions) |
Fundamental Principles of Spectroscopy
The underlying principles that govern all spectroscopic techniques are:
- Atoms and molecules absorb and emit electromagnetic radiation of specific energies
- Atoms and molecules undergo observable changes when they absorb electromagnetic radiation
- Different parts of the electromagnetic spectrum affect atoms or molecules in different ways
These principles allow us to use different types of radiation to probe different aspects of molecular structure and behavior.
Principles of infrared spectroscopy
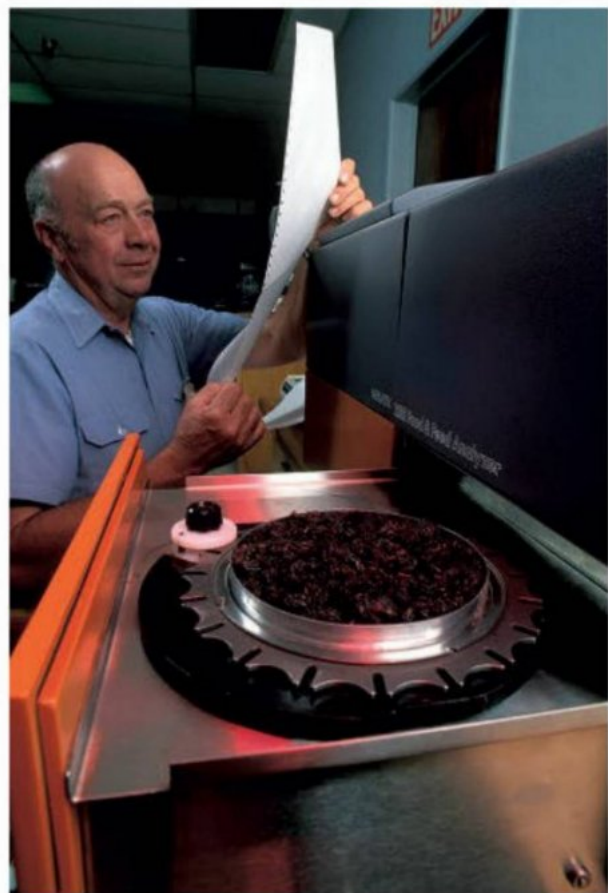
Infrared spectroscopy is a versatile analytical technique that can be applied to the analysis of organic and inorganic compounds in solid, liquid, or gaseous form. It serves as an essential quality control tool across many industries including pharmaceutical, agriculture, food processing, paint, and paper manufacturing. The technique has important applications in drug testing, analysis of biological molecules, blood and urine sample testing, and monitoring atmospheric pollutants.
The primary value of IR spectroscopy lies in its ability to identify functional groups present in organic molecules, which provides crucial information about molecular structure.
How infrared spectroscopy works
Infrared light possesses lower energy and longer wavelength compared to visible and ultraviolet light. The energy from infrared radiation is sufficient to change the vibrational state of bonds in molecules, but not enough to cause electronic transitions.
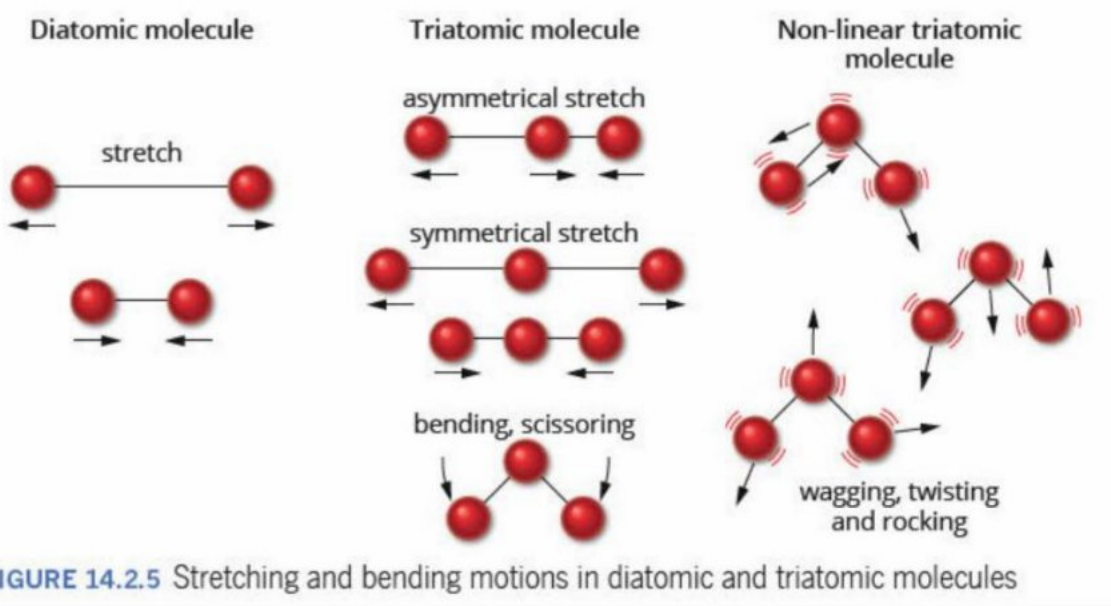
Covalent bonds behave similarly to springs that can undergo specific amounts of bending or stretching. When bonds bend or stretch, the atoms in a molecule change position and the molecule vibrates. Different types of molecular vibrations exist, including stretching motions (where bond lengths increase and decrease) and bending motions (where bond angles change).
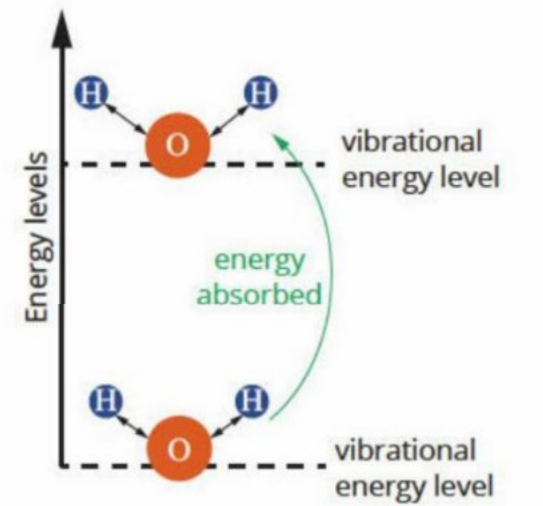
Vibrational energy levels
Molecules can only occupy discrete vibrational energy levels, meaning they exist at specific, quantised energy states. The energy difference between consecutive vibrational energy levels corresponds precisely to the energy contained in electromagnetic radiation from the infrared region. When molecules absorb infrared radiation, they transition from a lower vibrational energy level to a higher one, causing the stretching or bending vibrations of bonds to become more energetic.
The Dipole Moment Requirement
For a molecule to absorb IR radiation, the bending or stretching vibrations must change the overall dipole moment of the molecule. This requirement makes IR spectroscopy applicable to nearly all molecules, contributing to its power as an analytical technique.
Factors affecting infrared absorption
Two main factors influence the frequency of infrared radiation absorbed by a particular bond: bond strength and atomic mass.
Key Relationships in IR Absorption
Understanding these relationships is crucial for interpreting IR spectra:
Bond strength: The strength of a bond directly affects the frequency of infrared radiation it absorbs. Stronger bonds require more energy to stretch or bend, so they absorb infrared radiation of higher frequency. The frequency of vibration is directly proportional to the energy of vibration.
Memory aid: "Strong bonds, high energy" - stronger bonds absorb higher frequency IR radiation.
In infrared spectroscopy, frequency is expressed as wavenumber, measured in waves per unit distance with units of .
| Bond | Bond energy () | Infrared absorption frequency () |
|---|---|---|
| C≡C | 839 | 2300 |
| C=C | 614 | 1720 |
| C–C | 348 | 880 |
The table shows that a C–C single bond is weaker than a C=C double bond, which in turn is weaker than a C≡C triple bond. Correspondingly, the C–C bond absorbs infrared radiation of the lowest frequency, whilst the C≡C bond absorbs radiation of the highest frequency.
Effect of Atomic Mass on IR Absorption
The mass of atoms attached to a bond also influences the frequency of IR radiation absorbed:
- Atoms with higher masses absorb radiation of lower frequency
- Lighter atoms absorb radiation of higher frequency
Memory aid: "Light atoms, high frequency" - lighter atoms absorb higher frequency IR radiation.
| Bond | Typical absorption frequency () |
|---|---|
| C–H | 3000 |
| C–C | 1200 |
| C–O | 1100 |
| C–Cl | 750 |
| C–Br | 600 |
This trend reflects the increasing mass of atoms bonded to carbon, from hydrogen (lightest) through carbon and oxygen to chlorine and bromine (heaviest).
Inside an IR spectrophotometer
Understanding the components of an IR spectrophotometer helps explain how infrared spectra are obtained. A simple infrared spectrophotometer contains several essential components that work together to analyse samples.
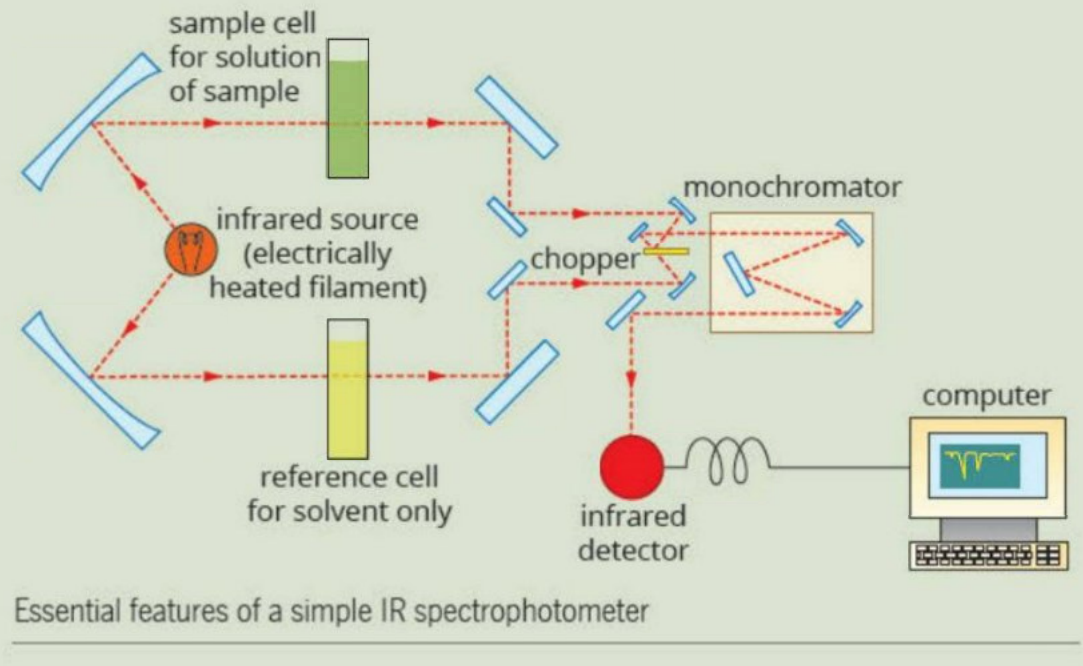
The infrared source, typically an electrically heated filament, produces infrared radiation. This radiation is split into two beams that pass separately through a sample cell and a reference cell. The sample cell contains a solution of the compound being analysed, whilst the reference cell contains only the solvent.
Special Materials for IR Spectroscopy
The material used to contain samples must be transparent to infrared radiation. Sodium chloride (NaCl), potassium bromide (KBr), or similar substances are used because plastic and glass absorb IR radiation and cannot be used.
Purpose of the Reference Cell
The reference cell serves an important purpose: it accounts for any interference from:
- Water vapour or carbon dioxide in the atmosphere
- The solvent used
- The material containing the sample
This ensures that only absorptions from the compound of interest are recorded in the spectrum.
Both beams pass through a rotating chopper, then through a wavelength selector called a monochromator, before reaching an infrared detector.
The detector measures the difference in transmittance (transmitted radiation) between the sample and reference cells. This difference arises because molecules in the sample absorb certain frequencies of infrared radiation. These absorptions correspond to changes in the vibrational energy of bonds in the molecule being examined. A computer system processes the detector output and displays the infrared spectrum.
Interpretation of infrared spectra
Learning to interpret infrared spectra is essential for identifying functional groups in unknown compounds. Understanding the key features of IR spectra enables you to determine which functional groups are present or absent in a molecule.
Features of an infrared spectrum
The horizontal axis:
The horizontal axis displays the wavenumber in units of . Wavenumber represents the number of waves per centimetre and is inversely proportional to wavelength. A bond vibrating at higher frequency absorbs IR radiation with higher wavenumber and greater energy than a bond vibrating at lower frequency.
The highest wavenumber typically appears on the left side of the spectrum. The axis often uses two different scales to ensure all features are visible. For example, the scale might show intervals of above , then change to intervals of below this value.
The vertical axis:
The vertical axis shows percentage transmittance on a scale from 0 to 100. The baseline of the spectrum, at 100% transmittance, indicates that all infrared light passes through the sample at that wavenumber. Where molecules absorb IR radiation, the spectrum dips down to lower transmittance values. These absorption bands appear as inverted peaks pointing downward from the baseline.
Describing absorption bands
Various terms describe the characteristics of absorption bands in IR spectra:
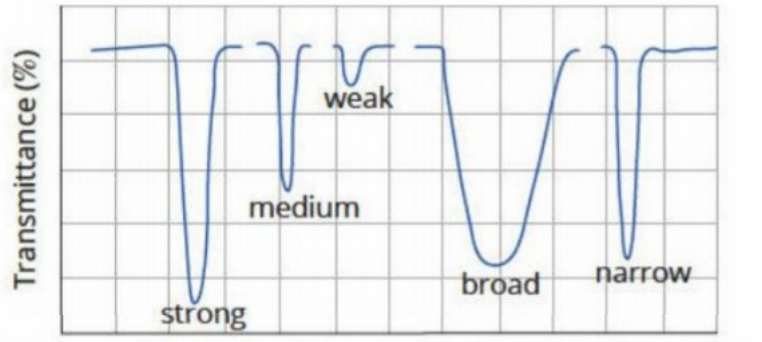
Width:
- Narrow bands span only a few wavenumbers, usually indicating absorption by one specific type of molecular vibration
- Broad bands result from several related vibrational changes with similar energies
Intensity:
- Strong bands show large absorption of radiation (deep dips in transmittance)
- Medium bands show moderate absorption
- Weak bands show small absorption (shallow dips)
The fingerprint region
The infrared spectrum can be divided into two main regions based on their utility for structure determination.
The Fingerprint Region
Absorption bands above approximately are used to identify functional groups because this region corresponds to the characteristic stretching vibrations of atoms in these groups.
The region below is called the fingerprint region because absorption patterns at these frequencies tend to be unique to each individual compound.
If a known compound and an unknown compound produce identical absorption spectra in the fingerprint region, they are almost certainly the same substance.
Characteristic absorption regions
Each type of bond absorbs IR radiation over a characteristic range of wavenumbers. Understanding these ranges allows you to identify functional groups present in unknown compounds.
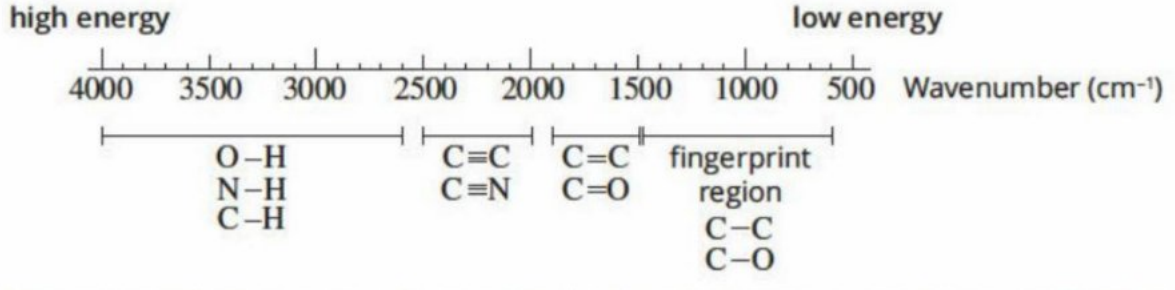
The diagram shows typical regions where different bonds absorb infrared radiation. High-energy, high-wavenumber absorptions appear on the left (around ), whilst low-energy absorptions appear on the right (around ).
Key Absorption Regions
The spectrum can be divided into characteristic regions:
- O–H, N–H, and C–H stretching: (high energy)
- Triple bonds (C≡C, C≡N):
- Double bonds (C=C, C=O):
- Fingerprint region (C–C, C–O): (low energy)
These regions help organize your approach to spectrum interpretation.
Using IR absorption data
When analysing an unidentified organic compound, chemists refer to tables showing the wavenumbers at which main functional groups absorb. This provides clues about bond types and functional groups present in the molecule.
| Bond | Wavenumber () |
|---|---|
| C–Cl | 600–800 |
| C–O (alcohols, esters, ethers) | 1050–1410 |
| C=C (alkenes) | 1620–1680 |
| C=O (amides) | 1630–1680 |
| C=O (aldehydes) | 1660–1745 |
| C=O (acids) | 1680–1740 |
| C=O (ketones) | 1680–1850 |
| C=O (esters) | 1720–1840 |
| O–H (acids) | 2500–3300 |
| C–H (alkanes, alkenes) | 2850–3090 |
| O–H (alcohols) | 3200–3600 |
| N–H (amines and amides) | 3300–3500 |
Critical Absorptions to Remember
Focus on these particularly characteristic and useful absorptions:
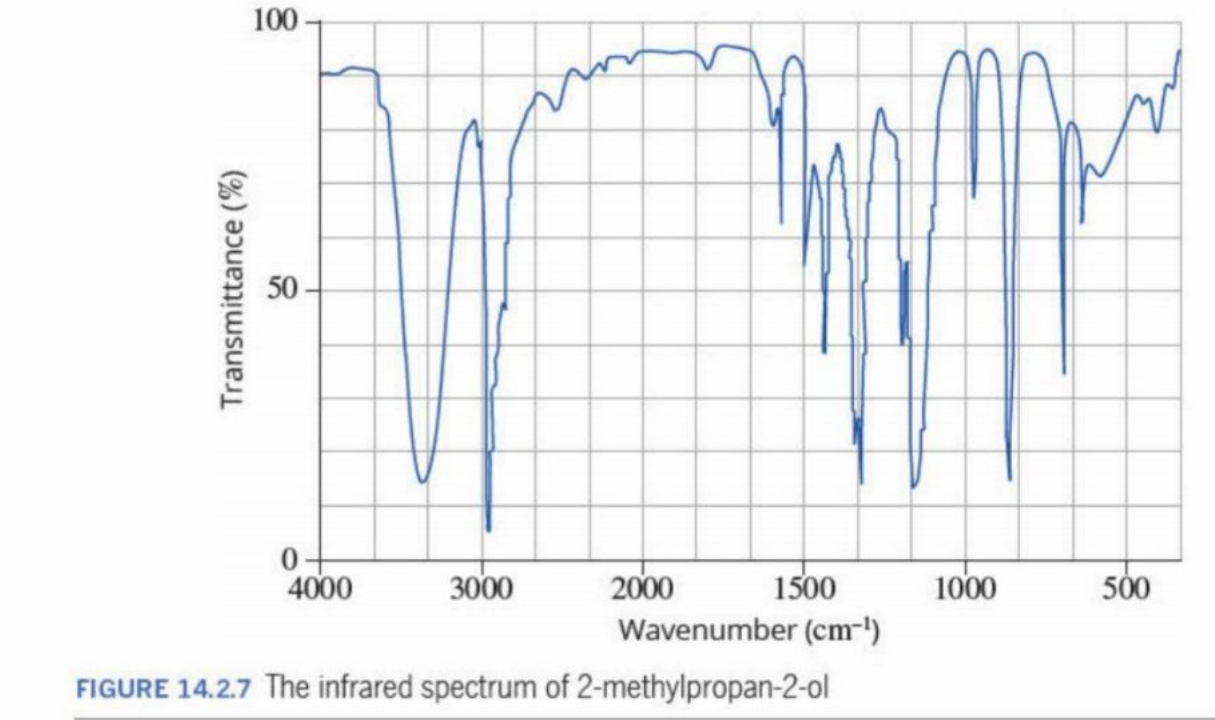
- O–H bonds (alcohols): Broad absorption around
- C=O bonds: Strong, narrow absorption around (varies slightly by functional group)
- O–H bonds (carboxylic acids): Very broad absorption from
These are the most distinctive and commonly used for identification.
For positive identification, the complete spectrum of an unknown compound can be compared to a database containing thousands of spectra of known compounds.
Distinguishing between similar compounds
Infrared spectroscopy proves particularly useful for distinguishing between structurally similar compounds, including isomers. The key is to identify which functional groups are present or absent based on characteristic absorption bands.
Comparing carboxylic acids and esters
Consider propanoic acid and methyl ethanoate, which are isomers with molecular formula .
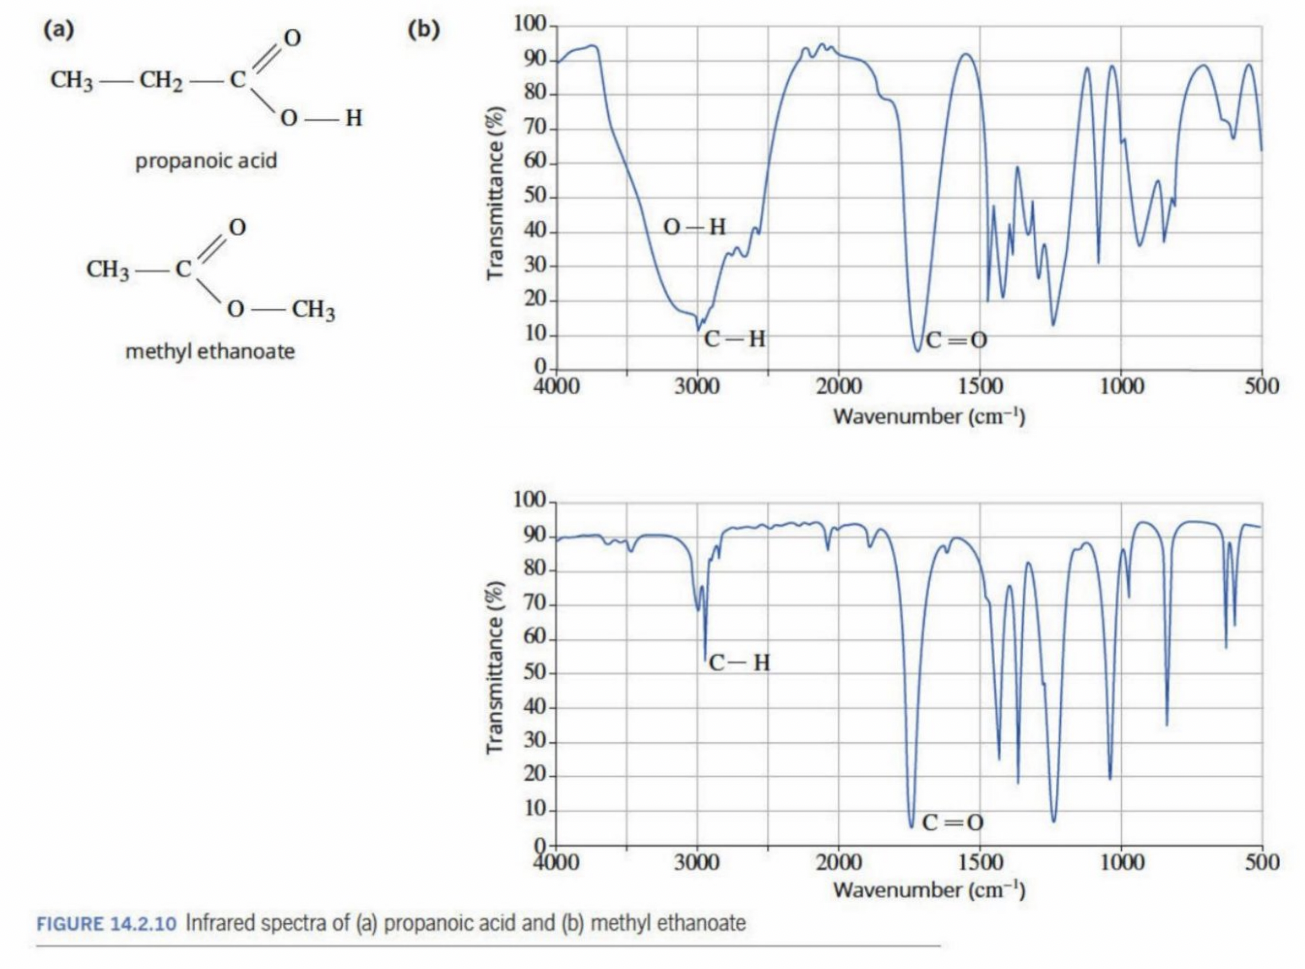
Identifying the Similarity
Both spectra show an absorption band at approximately due to stretching of the carbonyl (C=O) bond. This is expected since both molecules contain a carbonyl group.
Identifying the Key Difference
The key difference lies in the region around :
- Methyl ethanoate shows a narrow absorption band around due only to C–H bonds
- Propanoic acid shows a broad absorption band from to due to the O–H bond in the carboxyl group. This broad band partially masks the C–H absorption also present
This demonstrates an important principle: different types of covalent bonds absorb IR radiation within characteristic ranges of frequencies (wavenumbers), allowing functional groups in organic compounds to be identified.
Special case: primary amides
Primary amides display unusual IR spectra due to their ability to exist in two different structures. One hydrogen from the –NH₂ group can move to the oxygen, forming an alcohol group and a C=N bond.
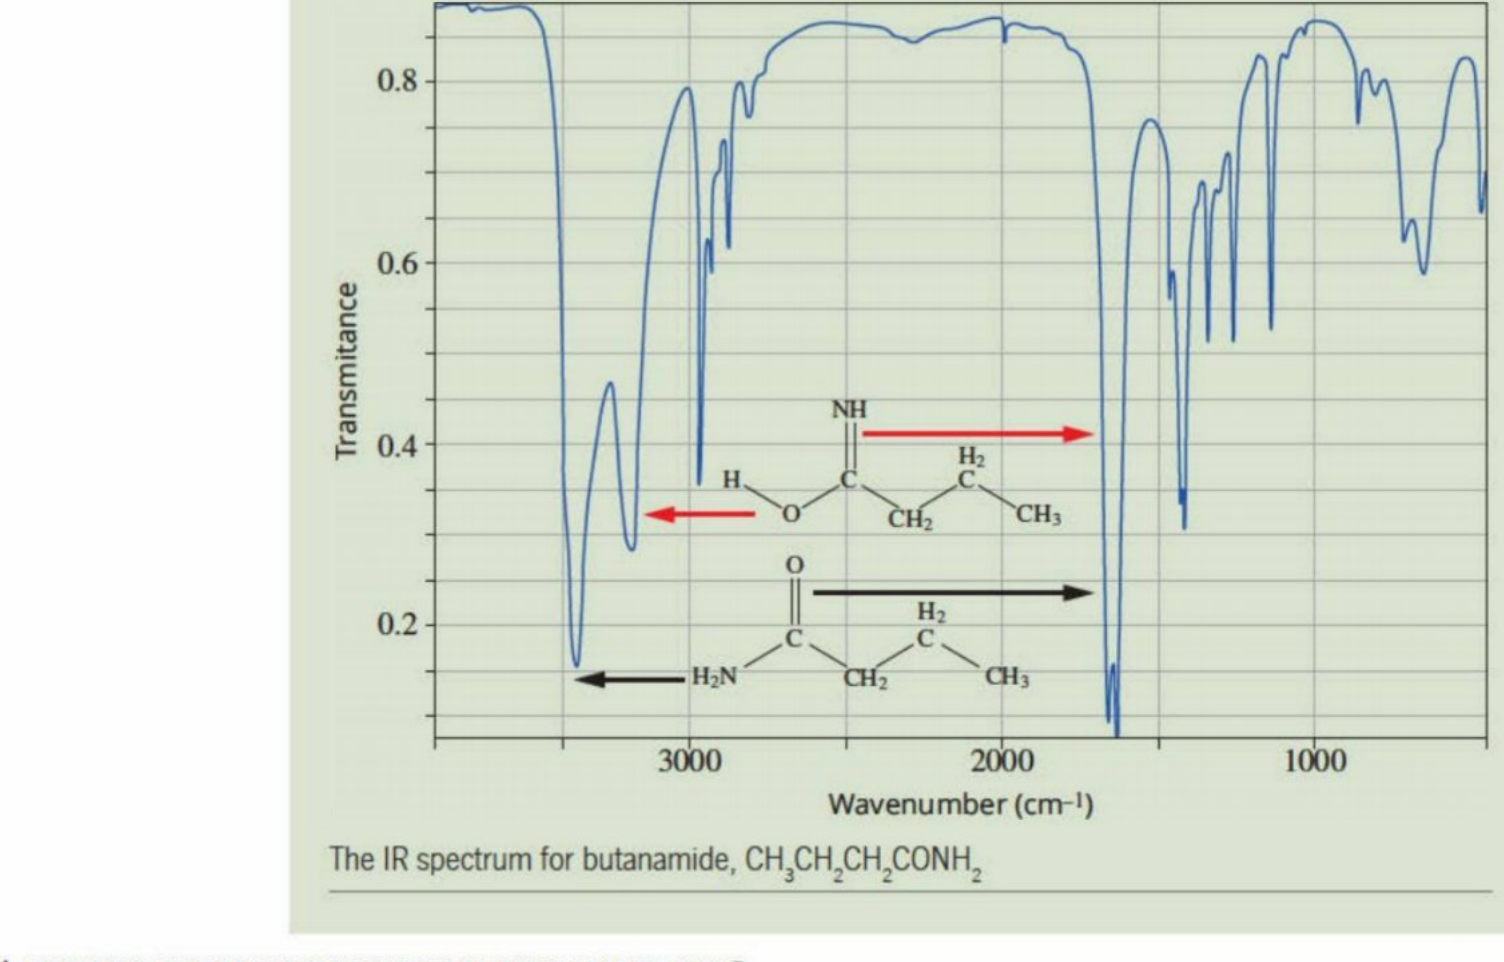
Double Peaks in Primary Amides
This structural flexibility produces double peaks:
- Around and (O–H and N–H stretching)
- Around and (C=N and C=O stretching)
These characteristic double peaks help identify primary amides specifically.
Worked example: identifying functional groups
Worked Example: Identifying an Unknown Compound from its IR Spectrum
To identify an unknown compound from its IR spectrum, follow a systematic approach:
- Examine the spectrum for characteristic absorption bands
- Compare absorption bands to reference data
- Identify which functional groups must be present
- Consider the molecular formula to confirm the structure
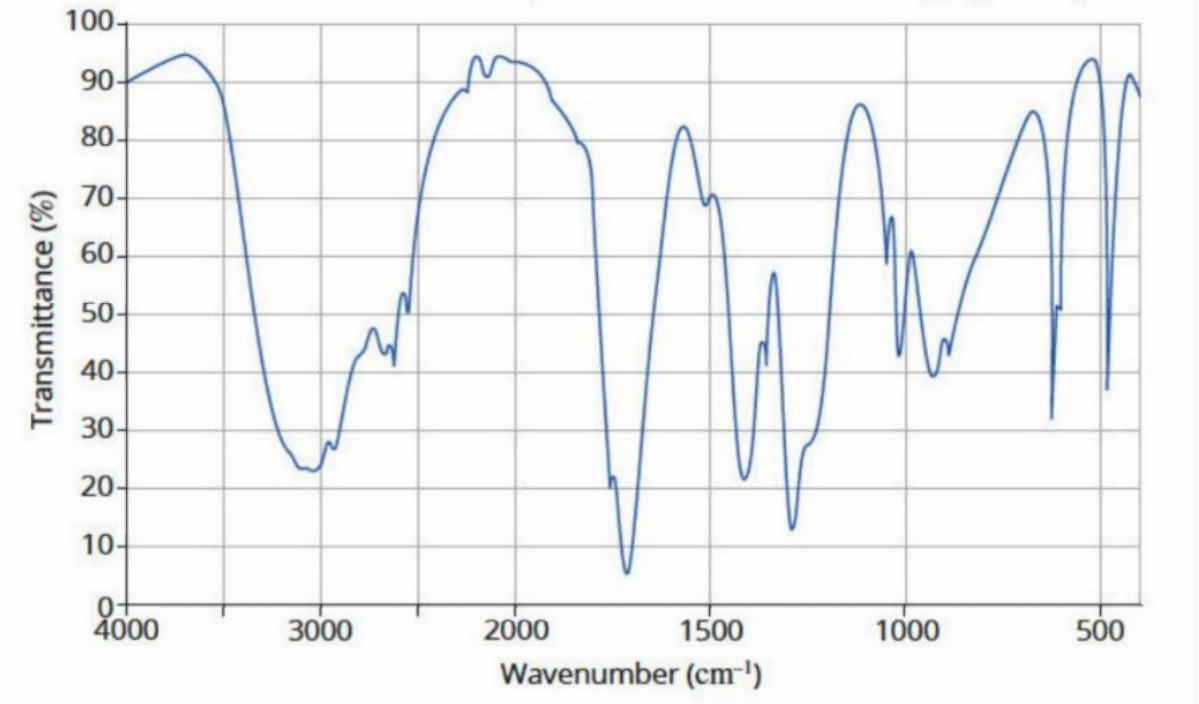
Solution:
| Step | Analysis |
|---|---|
| Identify absorption bands | There is a strong, narrow band at approximately , which corresponds to absorption by a carbonyl (C=O) group. The broad band centred at about corresponds to absorption by the O–H bond of a carboxylic acid. |
| Identify functional groups | The spectrum shows absorption bands corresponding to C=O and carboxylic acid O–H bonds. This suggests the presence of a carboxyl functional group (–COOH). From the formula, the compound is ethanoic acid, . |
The broad O–H absorption from a carboxylic acid (typically ) combined with a strong C=O absorption around provides strong evidence for a carboxyl group.
Applications of IR spectroscopy
Quality control and analysis
Infrared spectroscopy serves as a vital quality control tool across numerous industries. In pharmaceutical manufacturing, it verifies the identity and purity of drugs. In agriculture and food processing, it analyses product composition and quality. The technique can detect contaminants, confirm molecular structures, and ensure products meet specifications.
Medical diagnostics
Recent advances have extended IR spectroscopy into medical diagnostics. Researchers at Monash University have developed portable IR devices capable of rapidly detecting pathogens in blood samples. This technology diagnoses serious bloodstream infections (sepsis) in less than 30 minutes, compared to traditional methods requiring 1–6 days.

Revolutionary Diagnostic Technology
The technique identifies unique vibrational bands from cellular material of viruses, fungi, bacteria, and parasites, then compares these patterns to a database.
The rapid diagnosis greatly improves patient outcomes and provides access to advanced diagnostics for remote communities in developing countries.
Key Points to Remember
-
Infrared spectroscopy uses IR radiation to cause molecular vibrations, providing information about functional groups present in compounds
-
Wavenumber () expresses the frequency in IR spectroscopy. Higher wavenumbers correspond to higher energy absorptions
-
Stronger bonds and lighter atoms absorb IR radiation at higher wavenumbers (higher frequencies)
- Memory aid: "Strong bonds, high energy"
- Memory aid: "Light atoms, high frequency"
-
The fingerprint region (below ) produces unique absorption patterns for each compound
-
Key absorption ranges to remember:
- O–H (broad, for alcohols)
- C=O (strong, narrow, )
- C–H ()
- O–H acids (very broad, )
-
IR spectroscopy is particularly valuable for distinguishing between isomers by identifying which functional groups are present or absent