Mass Spectrometry (VCE SSCE Chemistry): Revision Notes
Mass Spectrometry
Introduction to mass spectrometry
Mass spectrometry (often abbreviated as MS) is one of the most powerful and widely used analytical techniques in chemistry. It can analyse samples in solid, liquid, or gaseous form, making it incredibly versatile for different types of chemical investigations.
One of the key strengths of mass spectrometry is its exceptional sensitivity. The technique can detect substances at extremely low concentrations, in the range of parts per billion to parts per trillion (equivalent to nanograms per kilogram). This means that even trace amounts of a compound can be identified and measured accurately.
The sensitivity of mass spectrometry is so remarkable that it's comparable to detecting a single drop of water in an Olympic-sized swimming pool. This extraordinary detection capability makes it an indispensable tool in fields requiring trace analysis, such as forensic science, environmental monitoring, and pharmaceutical research.
Mass spectrometry is particularly valuable for identifying unknown compounds. Each molecule produces a unique pattern in its mass spectrum, similar to how each person has a unique fingerprint. By comparing the mass spectrum of an unknown sample with spectra stored in a database, chemists can identify what the compound is.
The applications of mass spectrometry are diverse and far-reaching. Scientists use it to determine the structure of complex molecules like proteins and pharmaceutical drugs. In medicine, MS can detect molecular markers that indicate diseases such as cancer. The technique has even been used in space exploration - the Mars rover Curiosity, which NASA landed on Mars in 2012, carried a mass spectrometer to detect elements essential for life, particularly carbon, oxygen, nitrogen, phosphorus, and sulfur.

Mass spectrometry is frequently combined with other analytical techniques, especially chromatography, to analyse complex mixtures of substances.
How a mass spectrometer works
A mass spectrometer separates and identifies molecules based on their mass and charge. The instrument has several key components that work together in a specific sequence.
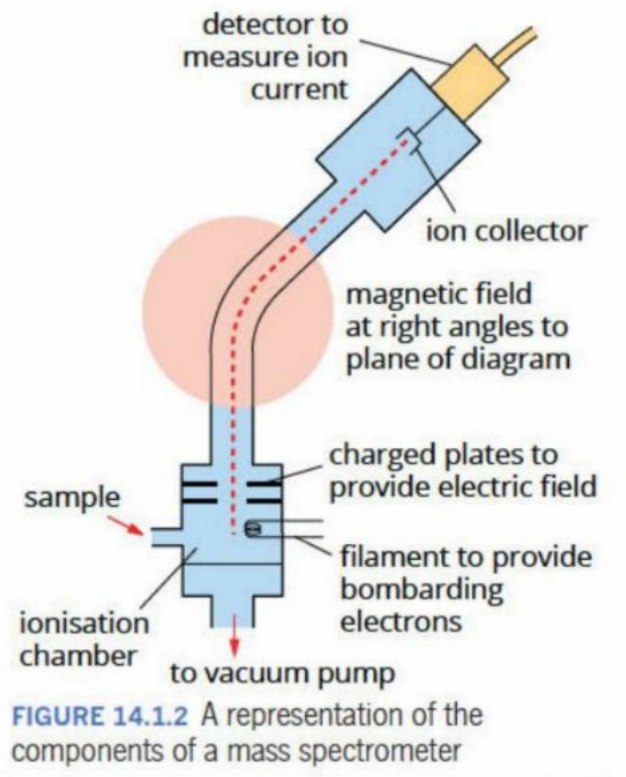
The process occurs in three main stages:
Ionisation: The sample is injected into an ionisation chamber. Here, the molecules encounter high voltages or undergo chemical reactions that cause them to lose electrons and become positively charged ions. This ionisation step is crucial because the instrument can only detect charged particles.
Separation: Once ionised, the ions are accelerated through a magnetic field. The magnetic field deflects the ions along curved paths. The amount of deflection depends on the ion's mass-to-charge ratio, written as . Lighter ions are deflected more than heavier ions, and ions with higher charges are deflected more than those with lower charges. This separation allows ions with different values to be distinguished.
Detection: After separation, the ions reach a detector that measures how many ions of each value are present. The detector counts the ions and records this information, which is then displayed as a mass spectrum graph.
The entire process takes place under vacuum conditions to prevent interference from air molecules. Without a vacuum, collisions with air molecules would scatter the ions and prevent accurate separation and detection.
Understanding a mass spectrum
A mass spectrum is a graph that displays the results from a mass spectrometer. The horizontal axis (x-axis) shows the mass-to-charge ratio (), whilst the vertical axis (y-axis) shows the relative intensity of each peak.
The molecular ion peak
The molecular ion peak appears at the highest value in the spectrum (excluding isotope peaks). This peak is formed when the entire molecule loses one electron but otherwise remains intact, becoming a positively charged molecular ion (also called the parent molecular ion).
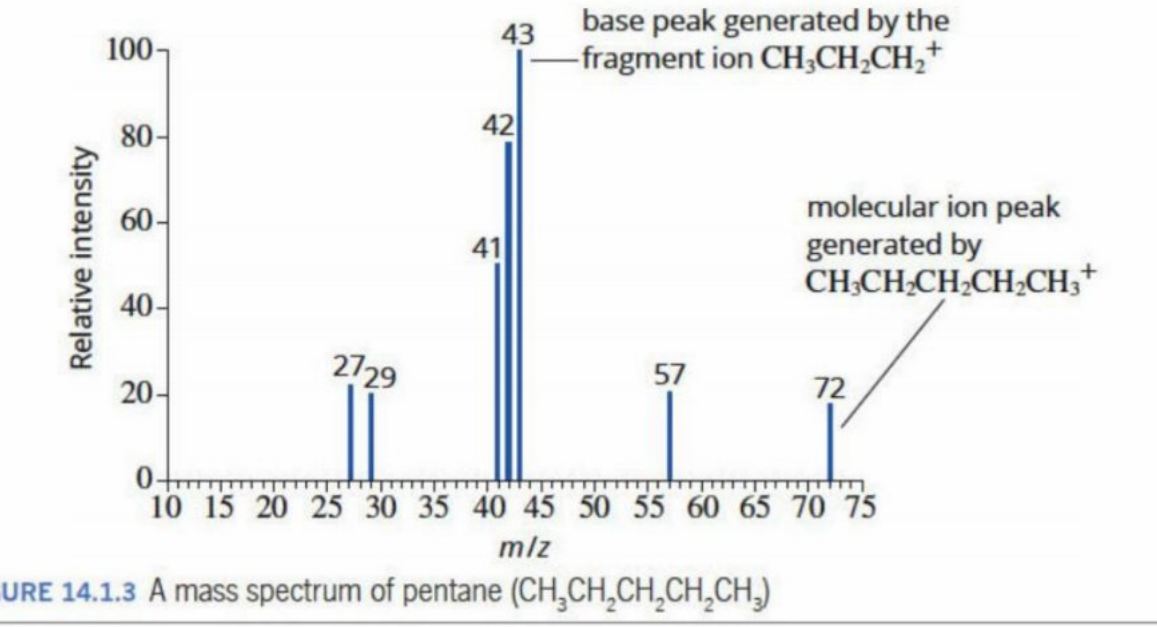
Understanding the Molecular Ion Peak: Pentane
In the pentane spectrum shown above, the molecular ion peak appears at . This corresponds to the complete pentane molecule () with a single positive charge.
When the molecule is ionised:
The resulting molecular ion has a mass of 72 atomic mass units.
When an ion has a charge (meaning ), the value equals the molecular mass of the ion. This relationship makes it straightforward to determine the molecular mass of a compound from its mass spectrum.
It's important to note that the molecular ion peak may be quite small in some mass spectra, as the molecular ion can be unstable and break apart readily. Some compounds produce such unstable molecular ions that the molecular ion peak is barely visible or even absent from the spectrum.
Fragment ions
The other peaks visible in a mass spectrum, which have lower values than the molecular ion, represent fragment ions. These are smaller pieces of the original molecule.
Fragment ions are created when the high-energy electrons in the ionisation chamber break chemical bonds within the molecular ion. Since covalent bonds are formed by sharing electrons, removing electrons weakens these bonds and can cause them to break entirely. The molecule then fragments into smaller pieces.
Different bonds in the molecule can break, producing various fragment ions. These fragments might be single atoms, small groups of atoms, or larger sections of the molecule. Because the mass spectrometer only detects positively charged species, all fragments shown in the spectrum must carry a positive charge (for example, ).
The base peak
The base peak is the tallest peak in the mass spectrum - the peak with the highest intensity. This peak is always assigned a relative intensity of 100%, and all other peaks are measured relative to it.
The base peak represents the most abundant and stable fragment ion produced during the fragmentation process. In the pentane spectrum, the base peak appears at , corresponding to the fragment ion .
Relative intensity is calculated by dividing the abundance of any peak by the abundance of the base peak, then multiplying by 100. This standardisation allows mass spectra to be compared easily, regardless of the actual amount of sample analysed.
The relative intensities of different peaks depend on several factors:
- The energy of the electrons used for ionisation
- How easily different fragments can form when bonds break
- The stability of the fragment ions once they're created
Common fragment ions
Certain fragment ions appear frequently in mass spectra of organic compounds. Recognising these common fragments helps with interpreting spectra and identifying unknown compounds.
| Formula | |
|---|---|
| 15 | |
| 17 | |
| 29 | , |
| 31 | |
| 35 and 37 | , |
| 43 | , |
| 45 | |
| 79, 81 | , |
This table shows that some values can correspond to multiple different fragments with the same mass. For instance, could be either an ethyl cation () or a formyl cation (). Additional information about the compound's structure is often needed to determine which fragment is actually present.
Interpreting mass spectra
Mass spectra provide valuable information about both the molecular mass and the structure of a compound. By carefully examining the peaks, chemists can deduce what fragments are present and how the molecule is put together.
Let's look at a detailed example using ethanoic acid ().
Worked Example: Interpreting the Mass Spectrum of Ethanoic Acid
Step 1: Ionisation
When ethanoic acid is ionised in a mass spectrometer, it loses an electron:
Step 2: Fragmentation
The resulting molecular ion () is unstable and fragments in various ways:
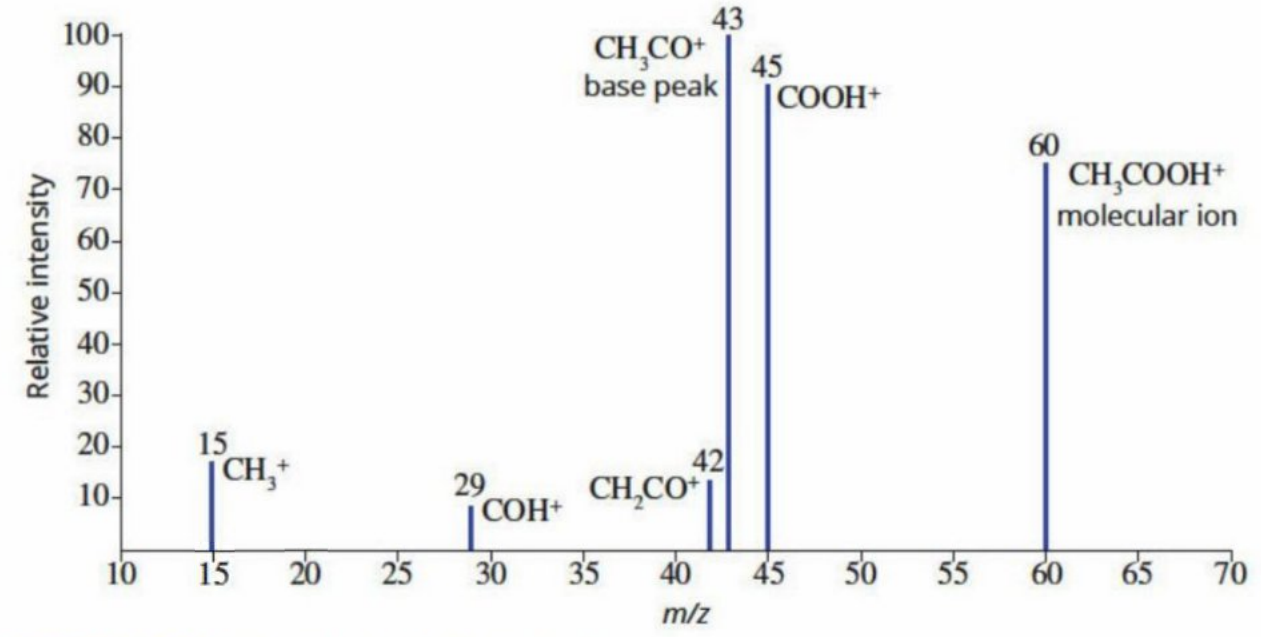
Step 3: Analysis of the Mass Spectrum
The mass spectrum of ethanoic acid shows several peaks, each corresponding to either the molecular ion or a fragment:
| Ion identity | Information provided by ion | |
|---|---|---|
| 60 | Molecular ion formed by loss of an electron | |
| 45 | Loss of from molecular ion | |
| 43 | Loss of from molecular ion | |
| 42 | Loss of from | |
| 29 | Loss of an atom from | |
| 15 | Loss of from molecular ion |
Conclusion:
The molecular ion peak at confirms that the relative molecular mass of ethanoic acid is 60. Each fragment peak provides clues about the molecular structure. For instance, the presence of a peak at () indicates the molecule contains a carboxylic acid group, whilst the peak at () shows there's a methyl group.
By piecing together this information from all the fragments, chemists can work out the complete structure of the original molecule.
Determining molecular formulas from mass spectra
Mass spectrometry can help determine the molecular formula of an unknown compound. If you know what type of compound you're dealing with (for example, an alkane), you can use the molecular ion peak to calculate the exact molecular formula.
Worked Example: Determining the Formula of an Alkane
Problem: An unbranched alkane has a molecular ion peak at . What is its molecular formula and name?
Step 1: Identify the molecular mass
The value of the molecular ion equals the relative molecular mass when the charge is . Therefore, the alkane has a molecular mass of 86.
Step 2: Apply the general formula
All alkanes follow the general formula , where is the number of carbon atoms.
Step 3: Set up the equation
We can set up an equation using the atomic masses of carbon (12) and hydrogen (1):
Step 4: Solve for n
Expanding this equation:
Step 5: Write the molecular formula
Therefore, the molecular formula is , which is hexane.
This method can be adapted for other types of compounds by using their appropriate general formulas. For example, alkenes have the general formula , and alcohols with one hydroxyl group have the formula .
Isotope effects in mass spectrometry
Most elements exist naturally as mixtures of different isotopes - atoms with the same number of protons but different numbers of neutrons. These isotopes have slightly different masses, and when they're present in molecules, they create additional peaks in the mass spectrum.
Isotope abundance
The table below shows the stable isotopes of some common elements and their natural abundance:
| Element | Isotope | Isotopic mass | Percentage abundance | Isotope | Isotopic mass | Percentage abundance |
|---|---|---|---|---|---|---|
| Hydrogen | ||||||
| Carbon | ||||||
| Chlorine | ||||||
| Bromine |
For hydrogen and carbon, the less common isotopes ( and ) are present in very small amounts. Consequently, molecular ions containing these isotopes produce only tiny peaks in mass spectra, which can often be ignored for basic analysis.
However, chlorine and bromine have substantial amounts of both isotopes. This means that molecules containing these elements show significant peaks for each isotope, which must be taken into account when interpreting the spectrum.
Chlorine isotope patterns
Chlorine exists as roughly 76% chlorine-35 and 24% chlorine-37. When a molecule contains one chlorine atom, the mass spectrum shows two molecular ion peaks separated by two mass units.
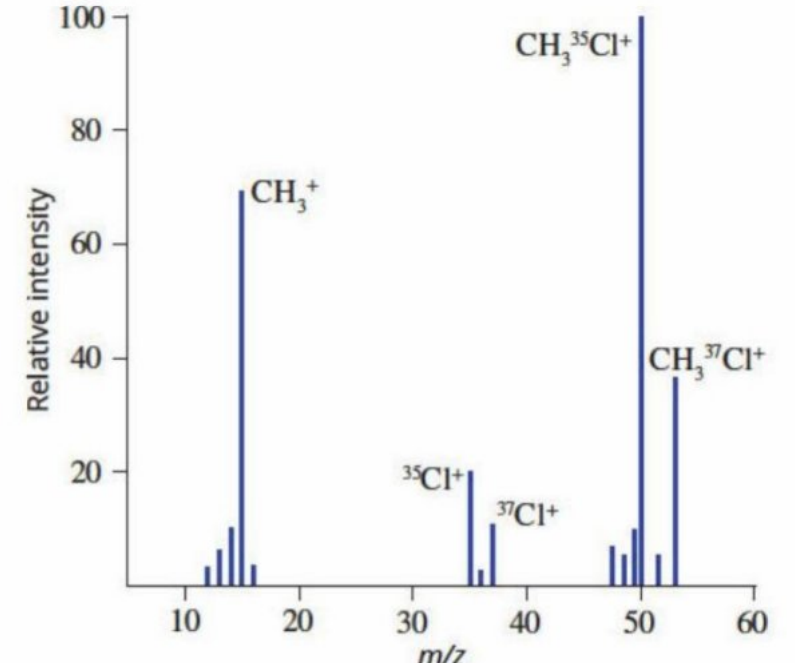
The mass spectrum of chloromethane () demonstrates this clearly:
- A peak at from molecules containing
- A peak at from molecules containing
The relative heights of these peaks reflect the natural abundance ratio of the two chlorine isotopes - the peak at is approximately three times taller than the peak at , matching the ratio of the isotopes.
Multiple chlorine atoms
When a molecule contains more than one chlorine atom, the isotope pattern becomes more complex. Each chlorine atom can be either or , creating multiple possible combinations.
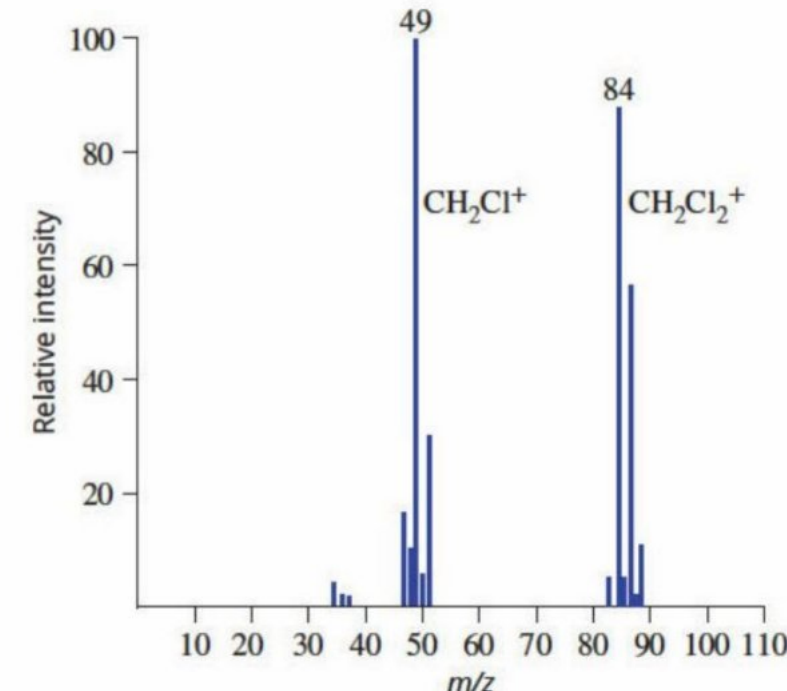
The mass spectrum of dichloromethane () shows three molecular ion peaks:
- At : molecules with two atoms
- At : molecules with one and one atom
- At : molecules with two atoms
The middle peak at is the tallest because there are two ways to get this combination (the can be in either position), making this molecular ion the most abundant.
Exam tip: The characteristic pattern of peaks separated by two mass units is a clear indicator that chlorine is present in the molecule. Similarly, bromine shows peaks separated by two mass units (at and ), but with nearly equal heights because the two bromine isotopes have almost equal abundance.
Case study: Platypus exposure to human drugs
Recent advances in mass spectrometry technology have dramatically improved the sensitivity and accuracy of chemical analysis. One sophisticated technique is triple quadrupole mass spectrometry (TQMS), which uses three separate magnetic fields to analyse samples in stages. This approach is particularly useful for complex environmental samples that may contain hundreds or thousands of different molecules with similar masses.
How TQMS Works
The first magnetic field (quadrupole) selects ions of a specific value corresponding to the target molecule. The second quadrupole fragments these ions into smaller pieces. The third quadrupole scans across all values to detect the specific fragment patterns. By comparing these patterns with those from a pure sample of the target molecule, researchers can unambiguously identify substances even at very low concentrations.
These enhanced analytical capabilities have revealed previously unknown environmental pollutants, including human medications. When people take medicines, their bodies excrete most of the active compounds in urine, which enters the sewage system. Unfortunately, many sewage treatment plants cannot completely remove these pharmaceutical chemicals, so they end up being released into local waterways.
Researchers at Monash University, Associate Professor Mike Grace and Dr Erinn Richmond, used advanced mass spectrometry to study this problem. They discovered 69 different medicines in aquatic insects and bugs from Melbourne streams, including antidepressants, antibiotics, antifungal drugs, and medications for blood pressure and cholesterol.

By measuring the concentration of medications in aquatic insects and estimating how many insects platypuses eat each day, the researchers calculated the daily dose of medicines that platypuses were consuming. Alarmingly, they found that platypuses living in streams receiving sewage treatment plant discharge were ingesting up to half the recommended therapeutic dose for humans of many common medications.
This case study demonstrates how mass spectrometry not only helps us understand chemical structures, but also reveals important environmental and health concerns that might otherwise remain hidden. It highlights the critical role of analytical chemistry in monitoring ecosystem health and protecting wildlife.
Remember!
Key Points to Remember:
-
Mass spectrometry separates and identifies ions based on their mass-to-charge () ratio, providing both molecular mass and structural information.
-
The molecular ion peak (at the highest value) gives the relative molecular mass of the compound, whilst fragment ion peaks reveal information about the molecular structure.
-
The base peak (at 100% relative intensity) represents the most abundant and stable fragment ion in the spectrum.
-
Isotopes of chlorine and bromine create characteristic patterns in mass spectra: peaks separated by two mass units with heights reflecting natural isotope abundance.
-
Mass spectrometry's exceptional sensitivity (parts per billion to trillion) makes it invaluable for applications ranging from protein analysis to environmental monitoring and space exploration.