Applications of Integration (VCE SSCE Mathematical Methods): Revision Notes
Applications of Integration
Integration is a powerful mathematical tool with many practical applications. This note explores two key applications: finding average values of functions and solving problems involving rates of change.
Average value of a function
When we want to find the typical or mean value of a function over an interval, we use integration. This is particularly useful in real-world scenarios where quantities vary continuously.
Definition and formula
The average value of a function over an interval can be calculated using the formula:
This formula works by:
- Finding the total area under the curve using the definite integral
- Dividing by the width of the interval to get the average height
Understanding the formula:
Think of the average value as "Area ÷ Width". The integral gives you the total area under the curve, and dividing by the interval width gives you the average height. It's like finding the mean of infinitely many function values across the interval.
Graphical interpretation
The average value has a useful geometric meaning. It represents the constant height that would create a rectangle with the same area as the region under the function's curve.
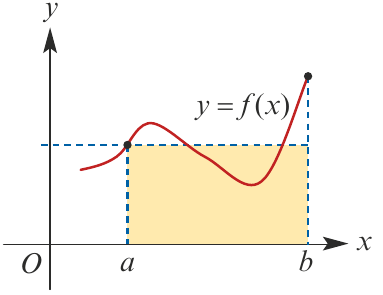
In the diagram above, the horizontal dashed line shows the average value. The yellow shaded area under the curve between and equals the area of a rectangle with:
- Width:
- Height: the average value
Key geometric insight:
The average value is the height of a rectangle that has exactly the same area as the region under the curve. This "same area, different shape" concept helps visualize what the average value actually means geometrically.
Worked Example: Finding the average value of a quadratic function
Question: Find the average value of for the interval . Illustrate with a horizontal line determined by this value.
Solution:
We apply the average value formula with and :
The average value is or approximately .
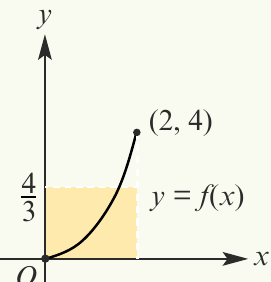
The graph shows the function (the curve) with the horizontal line at representing the average value. Notice how the rectangle formed between , , and the line has the same area as the region under the curve.
Verification: We can verify this by calculating:
- Area under curve:
- Rectangle area: width × height ✓
Rates of change
Integration allows us to work backwards from rates of change to find information about the quantity itself. When we know how quickly something is changing (the rate), we can determine the total change over a period by integrating.
This is similar to how knowing an object's velocity (rate of change of position) at any time allows us to determine its position using integration and initial conditions.
Integration accumulates change:
Think of integration as a way to "accumulate" all the tiny changes that happen continuously. If you know the rate at which something changes at every moment, integration adds up all those infinitesimal changes to give you the total change.
Application to cooling problems
A common application involves temperature change. When a hot object cools down, its rate of temperature decrease follows predictable patterns that can be modelled using differential equations.
Worked Example: Temperature change in a cooling liquid
Question: The rate of change of temperature with respect to time of a liquid which has been boiled and then allowed to cool is given by , where is the temperature (°C) at time (minutes).
a) Sketch the graph of against for .
b) Sketch the graph of against for .
c) i) Find the area of the region enclosed by the graph of part b, the x-axis and the lines and . Give your answer correct to two decimal places.
ii) What does this area represent?
Solution:
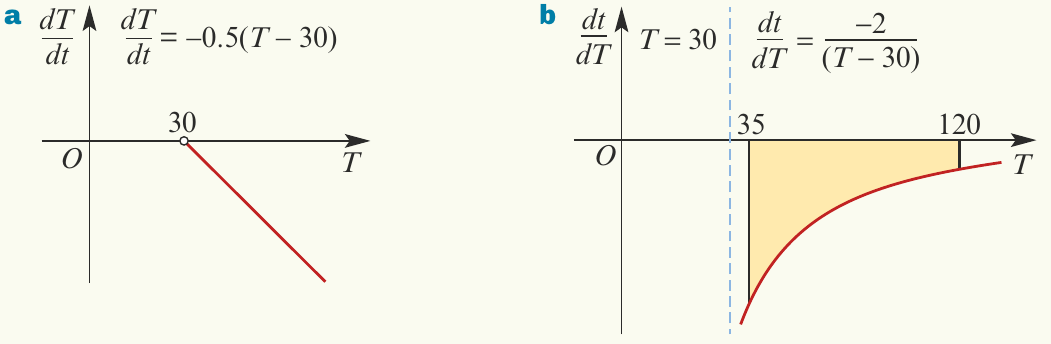
Part a:
The equation is linear in .
When :
As increases above 30, becomes more negative (steeper cooling rate).
The graph is a straight line passing through with negative gradient .
Part b:
To find , we take the reciprocal:
This is a reciprocal function with vertical asymptote at .
For , the graph shows a curve approaching the asymptote at and gradually increasing as increases.
Part c):
i) The area under the curve between and is:
ii) Physical interpretation: The area represents the time taken for the liquid to cool from 120°C to 35°C, which is approximately 5.78 minutes.
This makes sense because tells us the time per degree of temperature change. When we integrate this over a temperature range, we accumulate the total time needed for that temperature change.
Understanding reciprocal rates:
When dealing with reciprocal rates like instead of , remember: "flip the fraction, flip the variables." The reciprocal tells you how much time passes per degree of temperature change, so integrating it over a temperature range gives you total time.
Key Points to Remember:
-
The average value of a function over an interval is calculated using and represents the height of a rectangle with equivalent area to the region under the curve
-
Integration can work backwards from rates of change to find information about the quantity itself - we integrate the rate to find the total change
-
When dealing with reciprocal rates (like instead of ), remember that integrating gives you the accumulated value in the denominator variable
-
Always consider the physical meaning of your answer - for example, an area under a curve represents time, not just a number
-
The negative signs in rate of change problems often indicate decreasing quantities (like cooling temperatures) - take care with these when setting up and evaluating integrals